DKRZ PyNGL example counts per country#
Example:
#
# File:
# PyNGL_read_ASCII_and_plot_counts_per_country.py
#
# Synopsis:
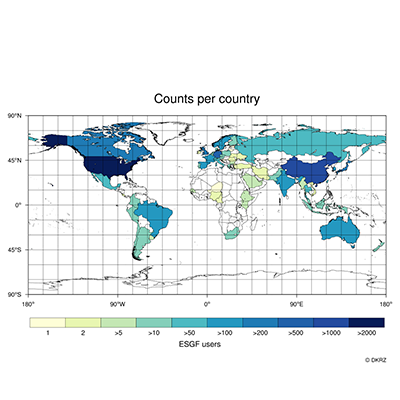
# Read ASCII data and draw countries of global map with colors depending on their values.
#
# Category:
# map plot
# labelbar
# read ASCII file
# text
#
# Based on DKRZ's NCL example:
# NCL_read_ASCII_and_plot_counts_per_country.ncl
#
# Author:
# Karin Meier-Fleischer
#
# Date of initial publication:
# December, 2018
#
# Description:
# Read ASCII data and draw countries of global map with colors depending on their values.
# Add a labelbar to the plot.
#
# Input file:
# country_gesamt.txt
#
# Effects illustrated:
# o Create a global map
# o Using area specifiers
# o Define color map
# o Read ASCII file
# o Create a labelbar
# o Add text
#
# Output:
# Two visualizations are produced.
#
'''
PyNGL Example: PyNGL_read_ASCII_and_plot_counts_per_country.py
- Create a global map
- Using area specifiers
- Define color map
- Read ASCII file
- Create a labelbar
- Add text
'''
from __future__ import print_function
from io import StringIO
import numpy as np
import Ngl,Nio
#-----------------------------------------------------------------------
#-- Function: main
#-----------------------------------------------------------------------
def main():
#-----------------------------------------------------------------------------------
#-- read ASCII input file (country; value)
#-----------------------------------------------------------------------------------
fin = open('country_gesamt.txt', newline='')
input = fin.read()
rows = input.strip('\n')
s = StringIO(rows) #-- in-memory stream for text
data = np.genfromtxt(s, dtype=['U30','i8'], names=['country','value'], delimiter=';')
#-- genfromtxt 'U' must be used for strings in Python3
states = list(data['country']) #-- in contrast to NCL it must be a list
values = data['value'][:] #-- data array
#-----------------------------------------------------------------------------------
#-- define levels and labels
#-----------------------------------------------------------------------------------
levels = [1,2,5,10,50,100,200,500,1000,2000] #-- value levels
labels = ["1","2",">5",">10",">50",">100",">200",">500",">1000",">2000"] #-- labelbar labels
#-----------------------------------------------------------------------------------
#-- define color map (index 0/1: foreground/background)
#-----------------------------------------------------------------------------------
cmap = np.array([[1.0, 1.0, 1.0], \
[0.0, 0.0, 0.0], \
[0.997785, 0.999139, 0.846059], \
[0.910127, 0.964937, 0.695640], \
[0.769320, 0.909419, 0.706959], \
[0.521292, 0.812964, 0.731073], \
[0.304483, 0.732118, 0.761430], \
[0.141961, 0.597647, 0.756078], \
[0.122107, 0.483137, 0.712711], \
[0.131949, 0.382745, 0.665467], \
[0.138408, 0.297578, 0.624990], \
[0.031373, 0.113725, 0.345098]],'f')
colors = np.arange(2,len(cmap)+1,1) #-- array for color indices
nlevels = len(levels) #-- number of levels
icols = np.ones(len(values),int) #-- assign array for color indices
#-- set the color indices array
for i in range(0,len(values)):
if(values[i] == levels[0]):
icols[i] = 0
if(values[i] > levels[nlevels-1]):
icols[i] = len(colors)
for j in range(0,nlevels-1):
if(values[i] > levels[j] and values[i] <= levels[j+1]):
icols[i] = colors[j]
print("State: %2.2i IPs: %4.2i %s" % (i,values[i],data['country'][i]))
#-----------------------------------------------------------------------------------
#-- open a workstation and set workstation resources
#-----------------------------------------------------------------------------------
wkres = Ngl.Resources()
wkres.wkWidth = 1024 #-- wk width
wkres.wkHeight = 1024 #-- wk height
wks = Ngl.open_wks("png","plot_counts_per_country_map_blue",wkres)
#-- set new color map (overwrite default colormap)
rlist = Ngl.Resources()
rlist.wkColorMap = cmap
Ngl.set_values(wks,rlist)
#-----------------------------------------------------------------------------------
#-- set resources
#-----------------------------------------------------------------------------------
res = Ngl.Resources()
res.nglMaximize = True #-- maximize plot
res.nglFrame = False #-- don't advance the frame yet
res.vpXF = 0.01 #-- x-position
res.vpYF = 0.95 #-- y-position
res.vpWidthF = 0.98 #-- width
res.vpHeightF = 0.95 #-- height
res.pmTickMarkDisplayMode = "Always" #-- turn on map tickmarks
res.mpDataSetName = "Earth..4" #-- new database
res.mpDataBaseVersion = "MediumRes" #-- Medium resolution database
res.mpOutlineOn = True #-- turn on map outlines
res.mpFillOn = True #-- turn on map fill
res.mpOutlineBoundarySets = "National" #-- draw only national bounds
res.mpOceanFillColor = "white" #-- set ocean fill color to white
res.mpLandFillColor = "white" #-- set land fill color to white
res.mpInlandWaterFillColor= "white" #-- set inland water fill color to white
res.mpFillAreaSpecifiers = states #-- fill listed states
res.mpSpecifiedFillColors = icols #-- use generated color array
res.mpMinLatF = -60 #-- don't plot Antarctica
res.tmXBLabelFontHeightF = 0.012 #-- change XB label font size
res.tmYLLabelFontHeightF = 0.012 #-- change YL label font size
res.tmXBMajorLengthF = 0.008 #-- change XB the tickmark length
res.tmYLMajorLengthF = 0.008 #-- change YL the tickmark length
res.tiMainString = "Counts per country" #-- title string
res.tiMainFont = "helvetica" #-- title string font
res.tiMainFontHeightF = 0.025 #-- set title string font size
#-- create the map
map = Ngl.map(wks,res)
#-----------------------------------------------------------------------------------
#-- add custom label bar to the plot
#-----------------------------------------------------------------------------------
vpx = Ngl.get_float(map,"vpXF") #-- retrieve viewport x-position
vpy = Ngl.get_float(map,"vpYF") #-- retrieve viewport y-position
vpw = Ngl.get_float(map,"vpWidthF") #-- retrieve viewport width
vph = Ngl.get_float(map,"vpHeightF") #-- retrieve viewport height
lbx, lby = vpx, vpy-vph-0.04
lbres = Ngl.Resources()
lbres.vpWidthF = vpw #-- width of labelbar
lbres.vpHeightF = 0.08 #-- height of labelbar
lbres.lbOrientation = "horizontal" #-- labelbar orientation
lbres.lbLabelFontHeightF = 0.012 #-- labelbar label font size
lbres.lbAutoManage = False #-- we control label bar
lbres.lbFillColors = colors #-- box fill colors
lbres.lbPerimOn = False #-- turn off labelbar perimeter
lbres.lbMonoFillPattern = True #-- turn on solid pattern
lbres.lbLabelAlignment = "BoxCenters" #-- write labels below box edges
#-- create the labelbar
pid = Ngl.labelbar_ndc(wks, nlevels, labels, lbx, lby, lbres)
#-----------------------------------------------------------------------------------
#-- add x-axis title and copyright string
#-----------------------------------------------------------------------------------
txres = Ngl.Resources()
txres.txJust = "CenterCenter"
txres.txFontHeightF = 0.014
Ngl.text_ndc(wks,"ESGF users",0.5,0.14,txres)
txres.txJust = "CenterRight"
txres.txFontHeightF = 0.010
Ngl.text_ndc(wks,"~F35~c ~F21~~N~DKRZ",vpx+vpw,0.10,txres)
#-----------------------------------------------------------------------------------
#-- advance the frame
#-----------------------------------------------------------------------------------
Ngl.frame(wks)
if __name__ == '__main__':
main()
Result: