PyNGL example curvilinear contour plot#
Software requirements:
Python 3
PyNGL 1.6.1
xarray
Run the curvilinear contour example script:
python PyNGL_curvilinear_contour.py
Script PyNGL_curvilinear_contour.py:
"""
DKRZ PyNGL Script: PyNGL_curvilinear_contour.py
Description: Python script using PyNGL Python module
- plot curvilinear data
Grid type: Curvilinear grid
Settings: - colormap,
- draw edges
09.02.21 meier-fleischer(at)dkrz.de
"""
import xarray as xr
import Ngl
#-----------------------------------------------------------------------
#-- Function: main
#-----------------------------------------------------------------------
def main():
#-- define variables
diri = '/sw/spack-levante/ncl-6.6.2-r3hsef/lib/ncarg/data/nug/' #-- data directory
fname = 'tos_ocean_bipolar_grid.nc' #-- curvilinear data
#-- open file and read variables
ds = xr.open_dataset(diri + fname)
tos = ds.tos[0,:,:]
lat2d = ds.lat[:,:]
lon2d = ds.lon[:,:]
var = tos.to_masked_array() #-- use variable _FillValues to mask data
#-- open a workstation
wkres = Ngl.Resources() #-- generate an resources object for workstation
wkres.wkWidth = 1024 #-- width of workstation
wkres.wkHeight = 1024 #-- height of workstation
wks_type = 'png' #-- output type
wks = Ngl.open_wks(wks_type,"Py_curvilinear_contour",wkres)
#-- set resources
res = Ngl.Resources() #-- generate an resources object for plot
#-- viewport resources
res.vpWidthF = 0.94 #-- width of viewport
res.vpHeightF = 0.9 #-- height of viewport
#-- contour resources
res.cnFillOn = True #-- turn on contour fill
res.cnLinesOn = False #-- don't draw contour lines
res.cnLineLabelsOn = False #-- don't draw line labels
res.cnFillPalette = 'BlueWhiteOrangeRed'
res.cnFillMode = 'CellFill' #-- change contour fill mode
res.cnCellFillEdgeColor = 'black' #-- edges color
res.cnCellFillMissingValEdgeColor = 'gray50' #-- missing value edges color
res.cnMissingValFillColor = 'gray50' #-- missing value fill color
#-- labelbar resources
res.lbOrientation = 'Horizontal' #-- labelbar orientation
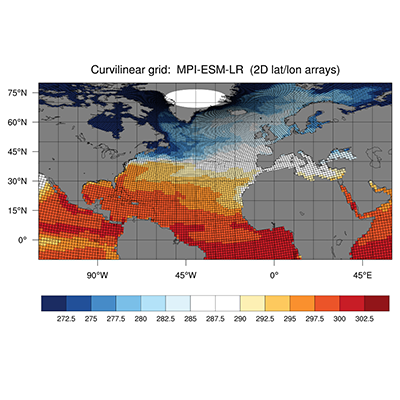
res.tiMainString = 'Curvilinear grid: MPI-ESM-LR (2D lat/lon arrays)'
res.tiMainFontHeightF = 0.022 #-- main title font size
#-- grid data to be used
res.sfXArray = lon2d.values #-- longitude grid cell center
res.sfYArray = lat2d.values #-- latitude grid cell center
#-- map resources
res.mpFillOn = False #-- don't draw filled map
res.mpGridLatSpacingF = 10. #-- grid lat spacing
res.mpGridLonSpacingF = 10. #-- grid lon spacing
res.mpDataBaseVersion = 'MediumRes' #-- map database
res.mpLimitMode = 'LatLon' #-- must be set using minLatF/maxLatF/minLonF/maxLonF
res.mpMinLatF = -10. #-- sub-region minimum latitude
res.mpMaxLatF = 80. #-- sub-region maximum latitude
res.mpMinLonF = -120. #-- sub-region minimum longitude
res.mpMaxLonF = 60. #-- sub-region maximum longitude
#-- create the plot
plot = Ngl.contour_map(wks, var, res) #-- create the contour plot
#-- done
Ngl.end()
if __name__ == '__main__':
main()
Plot result: