DKRZ PyNGL example filled circles based on quantities#
Examples:
#
# File:
# quality_points_per_grid_cell.py
#
# Synopsis:
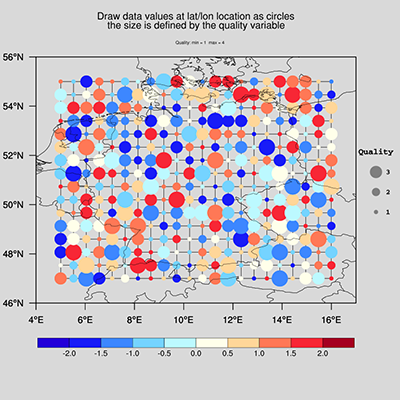
# Draw filled circles instead of grid cells. The size depends on a quality value.
#
# Category:
# contour plot
# polymarker
#
# Based on DKRZ's NCL example:
# quality_points_per_grid_cell.ncl
#
# Author:
# Karin Meier-Fleischer
#
# Date of initial publication:
# December, 2018
#
# Description:
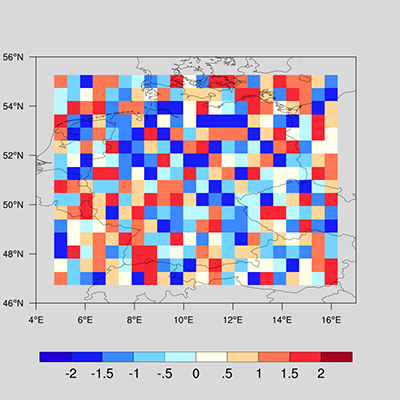
# Draw two plots, first plot is a raster contour plot and the second shows
# the data using filled circles which are sized by a quality variable.
#
# Effects illustrated:
# o Creating a contour cellFill plot
# o Using markers
# o Using dummy data
# o Create a legend
# o Create a labelbar
# o Add text
#
# Output:
# Two visualizations are produced.
#
'''
PyNGL Example: quality_points_per_grid_cell.py
- Creating a contour cellFill plot
- Using markers
- Using dummy data
- Create a legend
- Create a labelbar
- Add text
'''
from __future__ import print_function
import numpy as np
import Ngl,Nio
#-----------------------------------------------------------------------
#-- Function: main
#-----------------------------------------------------------------------
def main():
VALUES = True #-- turn on/off value annotation of first plot
GRID = True #-- turn on/off the data grid lines of second plot
#-----------------------------------------------------------------------------------
#-- which country to be shown
#-----------------------------------------------------------------------------------
minlat, maxlat = 47.0, 55.0 #-- minimum and maximum latitude of map
minlon, maxlon = 5.0, 16.0 #-- minimum and maximum longitude of map
#-----------------------------------------------------------------------------------
#-- generate dummy data and coordinates
#-- generate lat and lon arrays with named dimensions
#-----------------------------------------------------------------------------------
nlat, nlon = 16, 22
lat = np.linspace(minlat, maxlat, num=nlat)
lon = np.linspace(minlon, maxlon, num=nlon)
#-- generate dummy data with named dimensions
tempmin, tempmax, tempint = -2.0, 2.0, 0.5
temp = np.random.uniform(tempmin,tempmax,[nlat,nlon])
temp1d = temp.flatten()
ncells = len(temp1d)
#-- generate random dummy quality data
minqual, maxqual = 1, 4
quality = np.floor(np.random.uniform(minqual,maxqual+0.5,[nlat,nlon])).astype(int)
quality1d = quality.flatten()
#-----------------------------------------------------------------------------------
#-- graphics
#-----------------------------------------------------------------------------------
#-- open workstation
wkres = Ngl.Resources()
wkres.wkBackgroundColor = "gray85" #-- set background color to light gray
wks = Ngl.open_wks('png','plot_quality_per_cell',wkres)
#-- set color map
colmap = "BlueDarkRed18"
Ngl.define_colormap(wks,colmap)
#-- contour levels and color indices
cmap = Ngl.retrieve_colormap(wks)
ncmap = len(cmap[:,0])
levels = np.arange(tempmin,tempmax+tempint,tempint)
nlevels = len(levels)
colors = np.floor(np.linspace(2,ncmap-1,nlevels+1)).astype(int)
ncolors = len(colors)
#-----------------------------------------------------------------------------------
#-- contour plot resources
#-----------------------------------------------------------------------------------
res = Ngl.Resources()
res.nglDraw = False
res.nglFrame = False
res.nglMaximize = False #-- don't maximize plot output, yet
res.vpXF = 0.09 #-- viewport x-position
res.vpYF = 0.95 #-- viewport y-position
res.vpWidthF = 0.8 #-- viewport width
res.vpHeightF = 0.8 #-- viewport height
res.cnFillMode = "RasterFill" #-- use raster fill for contours
res.cnFillOn = True #-- filled contour areas
res.cnLinesOn = False
res.cnLineLabelsOn = False
res.cnInfoLabelOn = False
res.cnLevelSelectionMode = "ExplicitLevels" #-- set manual data levels
res.cnLevels = levels
res.cnMonoFillColor = False
res.cnFillColors = colors
res.lbBoxMinorExtentF = 0.15 #-- decrease height of labelbar
res.lbOrientation = "horizontal" #-- horizontal labelbar
res.mpOutlineBoundarySets = "National" #-- draw national map outlines
res.mpOceanFillColor = "gray90"
res.mpLandFillColor = "gray75"
res.mpInlandWaterFillColor = "gray75"
res.mpDataBaseVersion = "MediumRes" #-- alias to Ncarg4_1
res.mpDataSetName = "Earth..4" #-- higher map resolution
res.mpGridAndLimbOn = False
res.mpLimitMode = "LatLon" #-- map limit mode
res.mpMinLatF = minlat-1.0
res.mpMaxLatF = maxlat+1.0
res.mpMinLonF = minlon-1.0
res.mpMaxLonF = maxlon+1.0
res.sfXArray = lon
res.sfYArray = lat
#-----------------------------------------------------------------------------------
#-- first, we have to draw a contour map in memory to get the level and color values
#-----------------------------------------------------------------------------------
contour = Ngl.contour_map(wks,temp,res)
Ngl.draw(contour)
Ngl.frame(wks)
#-----------------------------------------------------------------------------------
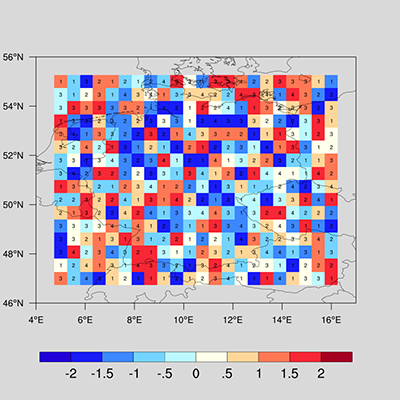
#-- for checking purposes: draw text and markers at data locations !! this takes long !!
#-----------------------------------------------------------------------------------
if(VALUES):
txres = Ngl.Resources()
txres.gsFontColor = "black"
txres.txFontHeightF = 0.01
for j in range(0,nlat):
for i in range(0,nlon):
m = i+j
txid = "txid"+str(m)
txid = Ngl.add_text(wks, contour,""+str(quality[j,i]),lon[i],lat[j],txres)
#-- draw the second plot
Ngl.draw(contour)
Ngl.frame(wks)
#-----------------------------------------------------------------------------------
#-- create third plot
#-----------------------------------------------------------------------------------
#-- clean contour plot and create a new map plot
plot = Ngl.map(wks,res)
#-----------------------------------------------------------------------------------
#-- draw grid lines of data region if set by GRID global variable
#-----------------------------------------------------------------------------------
if(GRID):
gres = Ngl.Resources()
gres.gsLineColor = "black"
for i in range(0,nlat):
lx = [minlon,maxlon]
ly = [lat[i],lat[i]]
lid = "lidy"+str(i)
lid = Ngl.add_polyline(wks,plot,lx,ly,gres) #-- add grid lines to plot
for j in range(0,nlon):
lx = [lon[j],lon[j]]
ly = [minlat,maxlat]
lid = "lidx"+str(j)
lid = Ngl.add_polyline(wks,plot,lx,ly,gres) #-- add grid lines to plot
Ngl.draw(plot)
#-----------------------------------------------------------------------------------
#-- now, create the marker size for each cell# marker sizes for quality 1-4
#-----------------------------------------------------------------------------------
marker_sizes = np.linspace(0.01,0.04,4)
ms_array = np.ones(ncells,float) #-- create array for marker sizes depending
#-- on quality1d
for ll in range(minqual,maxqual+1):
indsize = np.argwhere(quality1d == ll)
ms_array[indsize] = marker_sizes[ll-1]
#-- marker resources
plmres = Ngl.Resources()
plmres.gsMarkerIndex = 16 #-- filled circles
#-- now, create the color array for each cell from temp1d
gscolors = np.zeros(ncells,int)
#-- set color for data less than given minimum value
vlow = np.argwhere(temp1d < levels[0]) #-- get the indices of values less levels(0)
gscolors[vlow] = colors[0] #-- choose color
#-- set colors for all cells in between tempmin and tempmax
for i in range(1,nlevels):
vind = np.argwhere(np.logical_and(temp1d >= levels[i-1],temp1d < levels[i])) #-- get the indices of 'middle' values
gscolors[vind] = colors[i] #-- choose the colors
#-- set color for data greater than given maximum
vhgh = np.argwhere(temp1d > levels[nlevels-1]) #-- get indices of values greater levels(nl)
gscolors[vhgh] = colors[ncolors-1] #-- choose color
#-- add the marker to the plot
n=0
for ii in range(0,nlat):
for jj in range(0,nlon):
k = jj+ii
plmres.gsMarkerSizeF = ms_array[n] #-- marker size
plmres.gsMarkerColor = gscolors[n] #-- marker color
plm = "plmark"+str(k)
plm = Ngl.add_polymarker(wks,plot,lon[jj],lat[ii],plmres) #-- add marker to plot
n = n + 1
#-----------------------------------------------------------------------------------
#-- add a labelbar to the plot
#-----------------------------------------------------------------------------------
vpx = Ngl.get_float(plot,"vpXF") #-- retrieve viewport x-position
vpy = Ngl.get_float(plot,"vpYF") #-- retrieve viewport y-position
vpw = Ngl.get_float(plot,"vpWidthF") #-- retrieve viewport width
vph = Ngl.get_float(plot,"vpHeightF") #-- retrieve viewport height
lbx, lby = vpx, vpy-vph-0.07
lbres = Ngl.Resources()
lbres.vpWidthF = vpw #-- width of labelbar
lbres.vpHeightF = 0.08 #-- height of labelbar
lbres.lbOrientation = "horizontal" #-- labelbar orientation
lbres.lbLabelFontHeightF = 0.014 #-- labelbar label font size
lbres.lbAutoManage = False #-- we control label bar
lbres.lbFillColors = colors #-- box fill colors
lbres.lbPerimOn = False #-- turn off labelbar perimeter
lbres.lbMonoFillPattern = True #-- turn on solid pattern
lbres.lbLabelAlignment = "InteriorEdges" #-- write labels below box edges
#-- create the labelbar
pid = Ngl.labelbar_ndc(wks, ncolors, list(levels.astype('str')), lbx, lby, lbres)
#-----------------------------------------------------------------------------------
#-- add legend of marker sizes
#-----------------------------------------------------------------------------------
legres = Ngl.Resources() #-- legend resources
legres.gsMarkerIndex = 16 #-- filled dots
legres.gsMarkerColor = "gray50" #-- legend marker color
txres = Ngl.Resources() #-- text resources
txres.txFontColor = "black"
txres.txFontHeightF = 0.01
txres.txFont = 30
x, y, ik = 0.94, 0.47, 0
for il in range(minqual,maxqual):
legres.gsMarkerSizeF = marker_sizes[ik]
Ngl.polymarker_ndc(wks, x, y, legres)
Ngl.text_ndc(wks, ""+str(il), x+0.03, y, txres)
y = y + 0.05
ik = ik + 1
txres.txFontHeightF = 0.012
Ngl.text_ndc(wks,"Quality",x,y,txres) #-- legend title
#-----------------------------------------------------------------------------------
#-- add title string
#-----------------------------------------------------------------------------------
xpos = (vpw/2)+vpx
title1 = "Draw data values at lat/lon location as circles"
title2 = "the size is defined by the quality variable"
txres.txFont = 21
txres.txFontHeightF = 0.018
Ngl.text_ndc(wks, title1, xpos, 0.96, txres)
Ngl.text_ndc(wks, title2, xpos, 0.935, txres)
#-----------------------------------------------------------------------------------
#-- add center string
#-----------------------------------------------------------------------------------
y = vpy+0.035 #-- y-position
txcenter = "Quality: min = "+str(quality.min())+" max = "+str(quality.max())
txres.txFontHeightF = 0.008 #-- font size for string
txres.txJust = "CenterCenter" #-- text justification
Ngl.text_ndc(wks, txcenter, 0.5, y, txres) #-- add text to wks
#-----------------------------------------------------------------------------------
#-- draw the second plot and advance the frame
#-----------------------------------------------------------------------------------
Ngl.draw(plot)
Ngl.frame(wks)
if __name__ == '__main__':
main()
Results: