DKRZ PyNGL example linear regression and running mean#
Software requirements:
Python 3
PyNGL 1.6.1
xarray
numpy
scipy
Run the map example script:
python PyNGL_linear_regression_moving_average.py
Example PyNGL_linear_regression_moving_average.py:
import numpy as np
import xarray as xr
from scipy.interpolate import interp1d
from scipy import stats,signal
import Ngl, sys,os
#-----------------------------------------------------------
# Function create_legend()
#
# create a legend from scratch
#-----------------------------------------------------------
def create_legend(wks,labels,colors,dx,dy):
nlabs = len(labels)
txres = Ngl.Resources()
txres.txFontHeightF = 0.014 #-- default size is HUGE!
txres.txJust = "CenterLeft" #-- puts text on top of bars
plres = Ngl.Resources()
plres.gsLineThicknessF = 2.0 #-- set line thickness
x, y = np.array([0.0,0.02]),np.array([0.0,0.0])
dtx, ddy = 0.03, 0.02
for i in range(0,nlabs):
plres.gsLineColor = colors[i] #-- set line color
lg1 = Ngl.polyline_ndc(wks, x+dx, y+dy-(i*ddy), plres)
txres.txFontColor = colors[i] #-- set font color
Ngl.text_ndc(wks,labels[i], x+dx+dtx, y+dy-(i*ddy), txres)
#-----------------------------------------------------------------------
#-- Function: main
#-----------------------------------------------------------------------
def main():
#-- input file
diri = os.path.join(os.environ['HOME'], "NCL/PyNGL/tests/")
fname = "rectilinear_grid_2D.nc" #-- data file name
#-- open file and read variables
f = xr.open_dataset(os.path.join(diri,fname))
t = f['tsurf'][:,::-1,:] #-- first time step, reverse latitude
time = f['time'][:] #-- all timesteps
#-- create the x-axis values and labels use xarrays time format
itime = np.arange(0,len(time)) #-- x-axis values
date = [] #-- empty array to hold the date strings
for i in range(0,len(time)):
s = str(time[i].values).split('T')
date.append(s[0]) #-- x-axis labels
print('--> date: ',date)
print('--------------------')
#-- compute the mean of the 2d field (time,lat,lon)
t_mean1 = t.mean() #-- compute mean over all dimensions; returns 276.90332
t_mean2 = np.mean(t) #-- compute mean over all dimensions; returns 276.90332
#-- compute the field mean for each timestep -> time serie
t_mean2d = np.array(t.mean(dim=['lat','lon']))
print('--> data: ',t_mean2d)
print('--------------------------------------')
#-- trend computation: create rx and calculate the regression coefficient ry
rx = np.vstack([itime, np.ones(len(itime))]).T
m,t = np.linalg.lstsq(rx, t_mean2d, rcond=None)[0] #-- returns gradient and y-intersection
ry = (m*rx)+t
print('--> trend: ',ry[:,0])
print('--------------------------------------')
#-- moving average; large window value smooths the line
window = 4
weights = np.repeat(1.0, window)/window
t_mvavg = np.convolve(t_mean2d, weights, 'valid')
print('--> moving avg: ',t_mvavg)
print('--------------------------------------')
#-------------------------------
#-- graphics
#-------------------------------
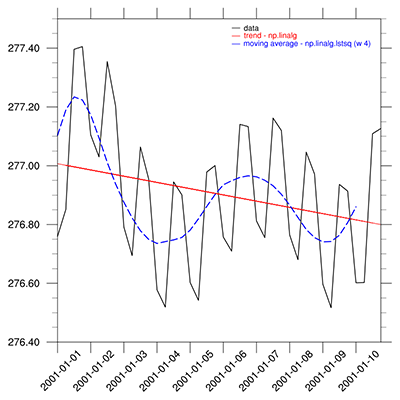
lg_labels = ['data',\
'trend - np.linalg',\
'moving average - np.linalg.lstsq (w 4)'] #-- legend labels
lg_colors = ['black','red','blue'] #-- line/legend colors
#-- open graphics output
wks = Ngl.open_wks('png','plot_interp_regress_stat')
res = Ngl.Resources() #-- plot options desired
res.nglDraw = False
res.nglFrame = False
res.nglPointTickmarksOutward = True #-- point tickmarks outward
res.caXMissingV = -999. #-- indicate missing value
res.caYMissingV = -999. #-- indicate missing value
res.trXMinF = 0.
res.trXMaxF = itime[-1]
res.trYMinF = 276.4
res.trYMaxF = 277.5
res.xyLineThicknessF = 3 #-- line thicknesses
res.xyLineColor = lg_colors[0] #-- line color
res.tmXBMode = 'Explicit' #-- use explicit values
res.tmXBValues = itime[::4] #-- use the new x-values array
res.tmXBLabels = date[::4] #-- use the new x-values array as labels
res.tmXBLabelFontHeightF = 0.008
res.tmXBLabelAngleF = 45
res.tmXBMinorOn = False #-- turn off minor tickmark
#-- base plot time series
plot0 = Ngl.xy(wks, itime, t_mean2d, res) #-- create the plot
#-- plot trend
res.xyLineColor = lg_colors[1] #-- line color
res.xyLineThicknessF = 2 #-- line thicknesses
res.xyDashPattern = 0 #-- line dash pattern
plot1 = Ngl.xy(wks,rx,ry,res)
Ngl.overlay(plot0,plot1)
#-- plot moving average
res.xyLineColor = lg_colors[2] #-- line color
res.xyLineThicknessF = 4 #-- line thicknesses
res.xyDashPattern = 1 #-- line dash pattern
plot2 = Ngl.xy(wks,itime,t_mvavg,res)
Ngl.overlay(plot0,plot2)
#-- draw the plot
Ngl.draw(plot0)
#-- create a legend from scratch
create_legend(wks,lg_labels,lg_colors,0.58,0.93)
#-- advance the frame
Ngl.frame(wks)
Ngl.end()
if __name__ == '__main__':
main()
Result: