DKRZ PyNGL example overlay two different grid resolutions#
Example:
#
# File:
# attach_map_to_map_Satellite.py
#
# Synopsis:
# Overlay different map and contour plots on a base map.
#
# Category:
# map plot
# contour plot
# polylines
# text
# overlay
#
# Based on DKRZ NCL example:
# attach_map_to_map_Satellite.ncl
#
# Author:
# Karin Meier-Fleischer
#
# Date of initial publication:
# December, 2018
#
# Description:
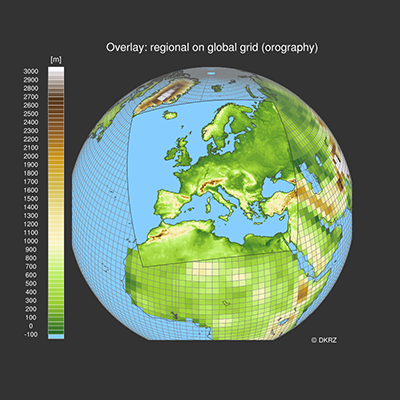
# The example shows the complexity of overlaying different maps and contour plots on a base map.
# To point the Satellite view up a grey shadow is attached to the regional contour plot.
#
# Effects illustrated:
# o Creating a map plot
# o Overlay two maps
# o Add polylines
# o Add text
#
# Output:
# A single visualization is produced.
#
'''
PyNGL Example: attach_map_to_map_Satellite.py
- Creating a map plot
- Overlay two maps
- Add polylines
- Add text
'''
from __future__ import print_function
import numpy as np
import os, sys
import Ngl,Nio
#-- global data
fname1 = "orog_fx_MPI-ESM-LR_rcp26_r0i0p0.nc" #-- orography
mname1 = "sftlf_fx_MPI-ESM-LR_rcp26_r0i0p0.nc" #-- land area fraction
#-----------------------------------------------------------------------
#-- Function: main
#-----------------------------------------------------------------------
def main():
#-- open file and read variables
f1 = Nio.open_file(fname1,"r") #-- open data file
var1 = f1.variables["orog"][:,:] #-- read variable orog
print(f1)
mask1 = Nio.open_file(mname1,"r") #-- open data file
lsm1 = mask1.variables["sftlf"][:,:] #-- read variable sftlf
lsm1 = np.where(lsm1 > 0.5, lsm1, 0)
land_only1 = np.where(lsm1 > 0.5, var1, -101) #-- min contour value - 1
lat = f1.variables["lat"][:] #-- latitudes
lon = f1.variables["lon"][:] #-- longitudes
dlat = lat[1]-lat[0]
dlon = lon[1]-lon[0]
#---------------------------------------------------------------------------
#-- regional data
#---------------------------------------------------------------------------
fname2 = "orog_EUR-11_MPI-M-MPI-ESM-LR_historical_r0i0p0_CLMcom-CCLM4-8-17_v1_fx.nc"
mname2 = "sftlf_EUR-11_MPI-M-MPI-ESM-LR_historical_r0i0p0_CLMcom-CCLM4-8-17_v1_fx.nc"
f2 = Nio.open_file(fname2,"r") #-- open data file
var2 = f2.variables["orog"][:,:] #-- read variable orog
mask2 = Nio.open_file(mname2,"r") #-- open data file
lsm2 = mask2.variables["sftlf"][:,:] #-- read variable sftlf
lsm2 = np.where(lsm2 > 0.5, lsm2, 0)
land_only2 = np.where(lsm2 > 0.5, var2, -101) #-- min contour value - 1
lat2d = f2.variables["lat"][:,:] #-- retrieve latitudes
lon2d = f2.variables["lon"][:,:] #-- retrieve longitudes
nlat = len(lat2d[:,0]) #-- number of latitudes
nlon = len(lon2d[0,:]) #-- number of longitudes
#---------------------------------------------------------------------------
#-- open workstation
#---------------------------------------------------------------------------
wkres = Ngl.Resources()
wkres.wkBackgroundColor = "grey20" #-- background color
wkres.wkForegroundColor = "white" #-- foreground color
wks_type = "png" #-- output graphic type
wks = Ngl.open_wks(wks_type,"plot_attach_map_to_map_Satellite",wkres) #-- open workstation
#---------------------------------------------------------------------------
#-- set resources
#---------------------------------------------------------------------------
res = Ngl.Resources()
res.nglDraw = False #-- don't draw plot yet
res.nglFrame = False #-- don't advance frame
res.nglMaximize = False
res.vpWidthF = 0.7 #-- viewport width
res.vpHeightF = 0.7 #-- viewport height
res.vpXF = 0.18 #-- start x-position
res.vpYF = 0.85 #-- start y-position
#---------------------------------------------------------------------------
#-- common map resources
#---------------------------------------------------------------------------
mapres = res
mapres.mpDataBaseVersion = "MediumRes" #-- map resolution
mapres.mpProjection = "Satellite" #-- map projection
mapres.mpLimitMode = "angles" #-- angles represent angular
mapres.mpLeftAngleF = 25. #-- deviation from the line
mapres.mpRightAngleF = 25. #-- of sight from the satellite
mapres.mpTopAngleF = 25. #-- to the projection center
mapres.mpBottomAngleF = 25. #
mapres.mpCenterLatF = 40. #-- center latitude
mapres.mpCenterLonF = 10. #-- center longitude
mapres.mpSatelliteAngle1F = 7.*57.2957795130823*np.arcsin(1./30.)/8. #-- 1.671437 to 3.58404
mapres.mpSatelliteAngle2F = 85. #-- orthogonal view
mapres.mpSatelliteDistF = 2.32 #-- n-times Earth distance
mapres.mpLabelsOn = False #-- no map labels
mapres.mpPerimOn = False #-- don't draw a box around the map plot
mapres.mpOutlineOn = True #-- draw coastal outlines
mapres.mpGeophysicalLineThicknessF = 1.7 #-- line thickness
mapres.mpGeophysicalLineColor = "grey30" #-- line color
mapres.mpGridAndLimbOn = False #-- don't draw map grid lines
mapres.mpFillOn = True #-- turn map fill on
mapres.mpFillDrawOrder = "PreDraw" #-- draw filled map first
mapres.mpOceanFillColor = [ 0.53, 0.808, 1.0 ] #-- ocean color
mapres.mpInlandWaterFillColor = [ 0.53, 0.808, 1.0 ] #-- inland water color
mapres.mpLandFillColor = [ 0.7, 0.7, 0.7 ] #-- land color
mapres.tmXBOn = False
mapres.tmXTOn = False
mapres.tmYROn = False
mapres.tmYLOn = False
mapres.tmXBBorderOn = False
mapres.tmXTBorderOn = False
mapres.tmYRBorderOn = False
mapres.tmYLBorderOn = False
map = Ngl.map(wks,mapres) #-- create the global base map
print("---> global map done")
#---------------------------------------------------------------------------
#-- common contour resources
#---------------------------------------------------------------------------
cmap = Ngl.read_colormap_file("OceanLakeLandSnow")
cmap[0,:] = [ 0.53, 0.808, 1.0,1.0 ] #-- use a brighter blue
cnres = res
cnres.cnFillOn = True #-- turn contour fill on
cnres.cnFillMode = "CellFill" #-- use raster fill
cnres.cnCellFillEdgeColor = "gray50"
cnres.cnLinesOn = False #-- don't draw contour lines
cnres.cnLineLabelsOn = False #-- don't draw contour line labels
cnres.cnInfoLabelOn = False #-- don't draw contour info label
cnres.cnFillPalette = cmap #-- choose color map
cnres.cnRasterSmoothingOn = False #-- do not smooth contouring
cnres.cnLevelSelectionMode = "ManualLevels" #-- use manual levels
cnres.cnMinLevelValF = -100.0 #-- minimum contour value
cnres.cnMaxLevelValF = 3000. #-- maximum contour value
cnres.cnLevelSpacingF = 50. #-- contour interval
cnres.tiXAxisString = "" #-- don't draw x-axis title
cnres.tiYAxisString = "" #-- don't draw y-axis title
cnres.tiMainString = "Overlay: regional on global grid (orography)"
cnres.tiMainFontHeightF = 0.02
cnres.lbAutoManage = False #-- control labelbar manually
cnres.lbBoxMinorExtentF = 0.15 #-- smaller labelbar boxes
cnres.lbOrientation = "vertical" #-- labelbar orientation
cnres.lbLabelFontHeightF = 0.012 #-- labelbar font size
cnres.pmLabelBarOrthogonalPosF = -1.3 #-- move labelbar to the left side of plot
cnres.pmLabelBarParallelPosF = 0.49 #-- move labelbar downwards# default: 0.5
cnres.lbLabelPosition = "left" #-- move labels to left side of labelbar
cnres.lbRightMarginF = -0.28 #-- move labelbar to the left
land_only1cyc,loncyc = Ngl.add_cyclic(land_only1,lon) #-- add cyclic point
cnres.sfXArray = loncyc
cnres.sfYArray = lat
plot1 = Ngl.contour(wks,land_only1cyc,cnres) #-- create global plot
print("---> contour plot1 done")
#-- overlay plot1 on map
Ngl.overlay(map,plot1)
print("---> overlay contour plot1 on global map")
#---------------------------------------------------------------------------
#-- regional contour resources
#---------------------------------------------------------------------------
cnres2 = cnres
cnres2.trYReverse = True #-- reverse y-axis
cnres2.tfDoNDCOverlay = False #-- transform to standard lat/lon
cnres2.sfXArray = lon2d #-- longitude array
cnres2.sfYArray = lat2d #-- latitude array
cnres2.lbLabelBarOn = False #-- don't draw a labelbar
cnres2.cnFillDrawOrder = "Draw" #-- draw last# default: "Draw"
cnres2.cnCellFillEdgeColor = "transparent"
cnres2.mpOutlineOn = True #-- draw coastal outlines
cnres2.mpGeophysicalLineThicknessF = 1.7 #-- line thickness
cnres2.mpGeophysicalLineColor = "gray30" #-- line color
cnres2.mpGridAndLimbOn = False #-- don't draw map grid lines
cnres2.mpFillOn = False #-- don't fill map
plot2 = Ngl.contour(wks,land_only2,cnres2) #-- create Europe plot
print("---> regional contour plot2 done")
#-- overlay plot2 on map
Ngl.overlay(map,plot2)
print("---> overlay contour plot2 on global map")
#---------------------------------------------------------------------------
#-- draw the edges of the regional map in black
#---------------------------------------------------------------------------
plres = Ngl.Resources()
plres.tfPolyDrawOrder = "PostDraw" #-- draw line last
plres.gsLineThicknessF = 1.5 #-- line thickness
plres.gsLineColor = "grey15" #-- line color
#---------------------------------------------------------------------------
#-- edges for the shadow box and the borderline of plot2
#---------------------------------------------------------------------------
lon_val_lower = lon2d[0,:]
lon_val_right = lon2d[:,nlon-1]
lon_val_left = lon2d[:,0]
lon_val_upper = lon2d[nlat-1,:]
lat_val_lower = lat2d[0,:]
lat_val_right = lat2d[:,nlon-1]
lat_val_left = lat2d[:,0]
lat_val_upper = lat2d[nlat-1,:]
upper = Ngl.add_polyline(wks, map, lon_val_upper, lat_val_upper, plres) #-- attach upper line
lower = Ngl.add_polyline(wks, map, lon_val_lower, lat_val_lower, plres) #-- attach lower line
left = Ngl.add_polyline(wks, map, lon_val_left, lat_val_left, plres) #-- attach left line
right = Ngl.add_polyline(wks, map, lon_val_right, lat_val_right, plres) #-- attach right line
print("---> black rectangle/edge done")
#-- add units and copyrights to wks
vpx = Ngl.get_float(map,"vpXF") #-- retrieve value of res.vpXF from plot
vpy = Ngl.get_float(map,"vpYF") #-- retrieve value of res.vpYF from plot
vpw = Ngl.get_float(map,"vpWidthF") #-- retrieve value of res.vpWidthF from plot
vph = Ngl.get_float(map,"vpHeightF") #-- retrieve value of res.vpHeightF from plot
units = f1.variables["orog"].attributes['units']
txres = Ngl.Resources()
txres.txFontHeightF = 0.014 #-- font size for left, center and right string
txres.txJust = "CenterCenter" #-- text justification
Ngl.text_ndc(wks, "["+units+"]", vpx-0.04, vpy, txres) #-- add text to wks
txres.txFontHeightF = 0.012 #-- font size for left, center and right string
Ngl.text_ndc(wks,"~F35~c ~F21~~N~DKRZ", vpx+vpw-0.07, vpy-vph, txres) #-- plot copyright info
#---------------------------------------------------------------------------
#-- draw the map
#---------------------------------------------------------------------------
Ngl.draw(map)
Ngl.frame(wks)
Ngl.end()
if __name__ == '__main__':
main()
Result: