DKRZ PyNGL example overlay#
Example:
from __future__ import print_function
import numpy as np
import Ngl,Nio
#-----------------------------------------------------------------------
#-- Function: main
#-----------------------------------------------------------------------
def main():
#-- open file and read variables
f = Nio.open_file("rectilinear_grid_3D.nc", "r")
t = f.variables["t"][0,0,:,:]
rhum = f.variables["rhumidity"][0,0,:,:]
lat = f.variables["lat"][:]
lon = f.variables["lon"][:]
#-- define workstation
wks = Ngl.open_wks("png","plot_overlay")
#-- plot resources for the map
mpres = Ngl.Resources()
mpres.nglDraw = False #-- don't draw plot
mpres.nglFrame = False #-- don't advance frame
mpres.mpOutlineOn = True #-- turn on map outlines
mpres.mpGeophysicalLineColor = "gray50" #-- map outline color
mpres.mpLimitMode = "LatLon" #-- limit map via lat/lon
mpres.mpMinLatF = 20.0 #-- min lat
mpres.mpMaxLatF = 60.0 #-- max lat
mpres.mpMinLonF = -10.0 #-- min lon
mpres.mpMaxLonF = 40.0 #-- max lon
#-- plot resources for the temperature plot
tres = Ngl.Resources()
tres.nglDraw = False #-- don't draw plot
tres.nglFrame = False #-- don't advance frame
tres.cnFillOn = True #-- turn on color fill
tres.cnFillPalette = "cmp_b2r" #-- set the colormap to be used
tres.cnLinesOn = False #-- turns off contour line labels
tres.cnLineLabelsOn = False #-- turns off contour line labels
tres.cnInfoLabelOn = False #-- turns off contour info label
tres.cnLevelSelectionMode = "ManualLevels" #-- select manual levels
tres.cnMinLevelValF = 240. #-- minimum contour value
tres.cnMaxLevelValF = 310. #-- maximum contour value
tres.cnLevelSpacingF = 2. #-- contour increment
tres.pmLabelBarOrthogonalPosF = -0.26 #-- move labelbar upward
tres.lbLabelFontHeightF = 0.009 #-- labelbar labe font size
tres.lbBoxMinorExtentF = 0.17 #-- decrease height of labelbar box
tres.lbOrientation = "horizontal" #-- horizontal labelbar
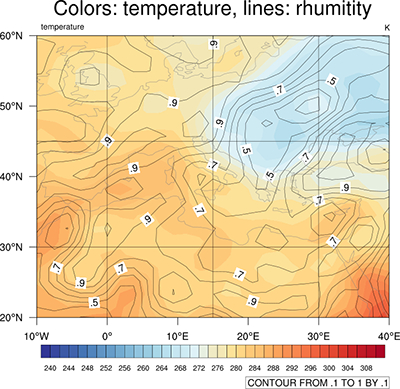
tres.tiMainString = "Colors: temperature, lines: rhumitity"
#-- title string
tres.sfXArray = lon
tres.sfYArray = lat
#-- plot resources for the rel. humidity plot
rres = Ngl.Resources()
rres.nglDraw = False #-- don't draw plot
rres.nglFrame = False #-- don't advance frame
rres.cnInfoLabelOrthogonalPosF = 0.13 #-- move info label upward
rres.sfXArray = lon
rres.sfYArray = lat
#-- generate the map base plot, but don't draw it yet
map = Ngl.map(wks,mpres)
#-- generate temperature plot, but don't draw it yet
tplot = Ngl.contour(wks,t,tres)
#-- generate rel. humidity plot, but don't draw it yet
rplot = Ngl.contour(wks,rhum,rres)
#-- overlay rplot on tplot
Ngl.overlay(map, tplot)
Ngl.overlay(map, rplot)
#-- draw the plot
Ngl.draw(map)
#-- add annotation of variable long_name and units to the plot
txres = Ngl.Resources()
txres.txFontHeightF = 0.014
Ngl.text_ndc(wks,f.variables["t"].attributes['long_name'],0.17,0.88,txres)
Ngl.text_ndc(wks,f.variables["t"].attributes['units'], 0.95,0.88,txres)
#-- advance the frame
Ngl.frame(wks)
if __name__ == '__main__':
main()
Result: