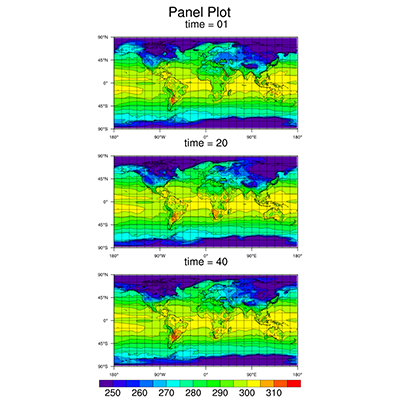
PyNGL example panel plot#
Software requirements:
Python 2.7.x
Numpy 1.9.2
PyNGL/PyNIO 1.5.0
Run the panel example script:
python PyNGL_panel.py
Script PyNGL_panel.py:
'''
 DKRZ PyNGL Script: PyNGL_panel.py

 Description:       plot 3 plots on one physical page

 11.05.15  meier-fleischer(at)dkrz.de
'''
import numpy,sys,os
import Ngl, Nio

#-----------------------------------------------------------------------
#-- Function: main
#-----------------------------------------------------------------------
def main():

    #--  define variables
    diri   = "$HOME/NCL/general/data/new_data/"    #-- data directory
    fname  = "rectilinear_grid_2D.nc"              #-- data file name

    minval =  250.                                 #-- minimum contour level
    maxval =  315                                  #-- maximum contour level
    inc    =    5.                                 #-- contour level spacing
    ncn    = (maxval-minval)/inc + 1               #-- number of contour levels

    #--  open file and read variables
    f      =  Nio.open_file(diri + fname,"r")

    temp   =  f.variables["tsurf"][0,::-1,:]        #-- first time step, reverse latitude
    temp19 =  f.variables["tsurf"][19,::-1,:]       #-- first time step, reverse latitude
    temp39 =  f.variables["tsurf"][39,::-1,:]       #-- first time step, reverse latitude

    lat    =  f.variables["lat"][::-1]              #-- reverse latitudes
    lon    =  f.variables["lon"][:]                 #-- all longitudes

    tempac   =  Ngl.add_cyclic(temp[:,:])           #-- add cyclic point
    temp19ac =  Ngl.add_cyclic(temp19[:,:])         #-- add cyclic point
    temp39ac =  Ngl.add_cyclic(temp39[:,:])         #-- add cyclic point

    #-- open a workstation
    wkres             =  Ngl.Resources()            #-- generate an resources object for workstation
    wkres.wkColorMap  = "rainbow"                   #-- choose colormap
    wkres.wkWidth     =  1024                       #-- width of workstation
    wkres.wkHeight    =  1024                       #-- height of workstation
    wks_type          = "png"                       #-- output type
    wks               =  Ngl.open_wks(wks_type,"Py_panel",wkres)  #-- open workstation

    #-- set res
    res                       =  Ngl.Resources()    #-- generate an res object for plot
    res.nglDraw               = False               #-- don't draw individual plots
    res.nglFrame              = False               #-- don't advance frame

    #-- viewport resources
    res.vpXF                  =  0.1                #-- viewport x-position
    res.vpYF                  =  0.75               #-- viewport y-position
    res.vpWidthF              =  0.7                #-- viewport width
    res.vpHeightF             =  0.7                #-- viewport height

    #-- contour resources
    res.cnFillOn              =  True               #-- turn on contour fill
    res.cnLineLabelsOn        =  False              #-- turn off line labels
    res.cnInfoLabelOn         =  False              #-- turn off info label
    res.cnLevelSelectionMode  = "ManualLevels"      #-- set manual levels
    res.cnMinLevelValF        =  minval             #-- minimum value
    res.cnMaxLevelValF        =  maxval             #-- maximum value
    res.cnLevelSpacingF       =  inc                #-- increment

    #-- grid resources
    res.sfXCStartV            =  float(min(lon))    #-- minimum longitude
    res.sfXCEndV              =  float(max(lon))    #-- maximum longitude
    res.sfYCStartV            =  float(min(lat))    #-- minimum latitude
    res.sfYCEndV              =  float(max(lat))    #-- maximum latitude

    #-- labelbar resources
    res.pmLabelBarDisplayMode = "Never"             #-- turn off the label bar

    #-- assign plot array for all 3 plots
    plot = []

    #-- create the plots, but don't draw it yet
    #-- plot 1
    res.tiMainString              = "time = 01"     #-- title string
    plot.append(Ngl.contour_map (wks,tempac,res))   #-- time = 0

    #-- plot 2
    res.tiMainString              = "time = 20"     #-- title string
    plot.append(Ngl.contour_map (wks,temp19ac,res)) #-- time = 19

    #-- plot 3
    res.tiMainString              = "time = 40"     #-- title string
    plot.append(Ngl.contour_map (wks,temp39ac,res)) #-- time = 39

    #-- draw a common title string on top of the panel
    textres               =  Ngl.Resources()
    textres.txFontHeightF =  0.025                  #-- title string size
    Ngl.text_ndc(wks,"Panel Plot",0.5,.97,textres)  #-- add title to plot

    #-- set some panel resources: a common labelbar and title
    #-- "[3,1]" indicates 3 row, 1 columns
    panelres                  =  Ngl.Resources()
    panelres.nglPanelLabelBar =  True               #-- common labelbar
    panelres.nglPanelYWhiteSpacePercent =  0        #-- reduce space between the panel plots
    panelres.nglPanelXWhiteSpacePercent =  0        #-- reduce space between the panel plots
    panelres.nglPanelTop      =  0.95               #-- top position of panel

    #-- create the panel
    Ngl.panel(wks,plot,[3,1],panelres)

    #-- done
    Ngl.end()

if __name__ == '__main__':
    main()
Result: