DKRZ PyNGL example plot curvilinear data#
Note
We will use xarray in the future exclusively for reading and writing data files because at the beginning of 2019 NCAR has decided to freeze PyNIO until further notice.
Example script:
'''
Script:
curvilinear_data_CORDEX_EUR-11.py
Description:
Example of how to plot curvilinear data.
Effects illustrated:
- Plotting curvilinear data
- Filled contour plot
'''
import os
import numpy as np
import xarray as xr
import Ngl
#-----------------------------------------------------------------------
#-- Function: add_titles(wks,plot,resources,title,left,center,right)
#-----------------------------------------------------------------------
def add_titles(wks,plot,title="",left="",center="",right=""):
vpx = Ngl.get_float(plot,"vpXF") #-- retrieve value of res.vpXF from plot
vpy = Ngl.get_float(plot,"vpYF") #-- retrieve value of res.vpYF from plot
vpw = Ngl.get_float(plot,"vpWidthF") #-- retrieve value of res.vpWidthF from plot
vph = Ngl.get_float(plot,"vpHeightF") #-- retrieve value of res.vpHeightF from plot
ymax = vpy+0.08 #-- we need space for the title and strings
if(ymax > 0.98):
print("--> if you can't see the title use res.nglMaximize = False and/or set res.vpYF")
#-- add title
if(title != ""):
tires = Ngl.Resources()
tires.txFontHeightF = 0.018
tires.txJust = "CenterCenter"
tires.txFont = 22 #-- Font 22: Helvetica bold
if(left != "" or center != "" or right != ""):
y = vpy + 0.06
else:
y = vpy + 0.04
vpxc = vpx + (vpw/2)
Ngl.text_ndc(wks, title, vpxc, y, tires)
#-- add left, center and/or right string
txres = Ngl.Resources()
txres.txFontHeightF = 0.014 #-- font size for left, center and right string
y = vpy + 0.02 #-- y-position
if(left != ""):
txres.txJust = "CenterLeft" #-- text justification
x = vpx #-- x-position
Ngl.text_ndc(wks, left, x, y, txres) #-- add text to wks
if(center != ""):
txres.txJust = "CenterCenter" #-- text justification
Ngl.text_ndc(wks, center, 0.5, y, txres) #-- add text to wks
if(right != ""):
txres.txJust = "CenterRight" #-- text justification
x = vpx+vpw #-- x-position
Ngl.text_ndc(wks, right, x, y, txres) #-- add text to wks
#-----------------------------------------------------------------------
#-- Function: main
#-----------------------------------------------------------------------
def main():
#-- set file name
home = os.environ.get('HOME')
diri = 'data/CORDEX/EUR-11'
fname = 'tas_EUR-11_MPI-M-MPI-ESM-LR_rcp45_r1i1p1_CLMcom-CCLM4-8-17_v1_mon_200601-201012.nc'
file_name = os.path.join(home,diri,fname)
#-- variable name
varname = 'tas'
#-- open file
ds = xr.open_dataset(file_name)
#-- read the variables
var = ds[varname][0,:,:]
lat2d = ds['lat'] #-- 2D coordinate
lon2d = ds['lon'] #-- 2D coordinate
print('lat2d.shape: {}'.format(lat2d.shape))
print('lon2d.shape: {}'.format(lon2d.shape))
#-- open a workstation
wks_type = "png" #-- output type
wks = Ngl.open_wks(wks_type,'plot_curvilinear_data_CORDEX_EUR-11')
#-- set resources
res = Ngl.Resources() #-- generate an resources object for plot
res.nglFrame = False
res.nglMaximize = True
res.cnFillOn = True #-- turn on contour fill
res.cnLinesOn = False #-- don't draw contour lines
res.cnLineLabelsOn = False #-- don't draw line labels
res.cnFillPalette = "BlueYellowRed" #-- set color map
res.cnLevelSelectionMode = "ManualLevels"
res.cnMinLevelValF = 250
res.cnMaxLevelValF = 290
res.cnLevelSpacingF = 2
res.lbOrientation = "Horizontal" #-- labelbar orientation
res.sfXArray = lon2d.values #-- longitude grid cell center
res.sfYArray = lat2d.values #-- latitude grid cell center
res.mpFillOn = False #-- don't draw filled map
res.mpGridLatSpacingF = 10. #-- grid lat spacing
res.mpGridLonSpacingF = 10. #-- grid lon spacing
res.mpDataBaseVersion = "MediumRes" #-- map database
res.mpLimitMode = "LatLon" #-- must be set using minLatF/maxLatF/minLonF/maxLonF
res.mpMinLatF = 15. #-- sub-region minimum latitude
res.mpMaxLatF = 80. #-- sub-region maximum latitude
res.mpMinLonF = -50. #-- sub-region minimum longitude
res.mpMaxLonF = 70. #-- sub-region maximum longitude
#-- create the plot
plot = Ngl.contour_map(wks,var,res) #-- create the contour plot
#-- add the title and left, center and/or right string
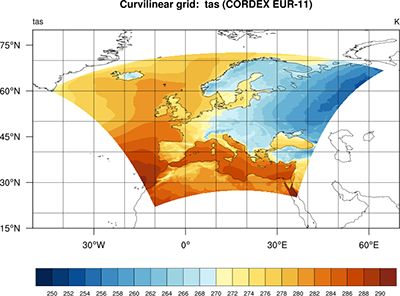
title = "Curvilinear grid: tas (CORDEX EUR-11)" #-- main title string
if var.attrs['units']: #-- retrieve units attribute
units = var.attrs['units']
add_titles(wks,plot,title=title,left=varname,right=units)
#-- advance the frame
Ngl.frame(wks)
#-- end
Ngl.end()
if __name__ == '__main__':
main()
Result: