DKRZ PyNGL example polar plot#
Example script:
#
# File:
# contour_plot_polar_projection.py
#
# Synopsis:
# Illustrates how to plot contour lines on polar map plot
#
# Categories:
# map plot
# contours
# labelbar
# text
#
# Author:
# Karin Meier-Fleischer, based on NCL example
#
# Date of initial publication:
# February 2019
#
# Based on NCL example:
# polar_1.ncl
#
# Description:
# This example shows how to plot contour lines on polar map plot.
#
# Effects illustrated:
# o Drawing polar map
# o Drawing contours
# o Customize labelbar
# o Use overlay
# o Add text
#
# Output:
# A single visualization is produced.
#
# Notes: The data for this example can be downloaded from
# http://www.ncl.ucar.edu/Document/Manuals/NCL_User_Guide/Data/
#
'''
Transition Guide Python Example: contour_plot_polar_projection.py
- Drawing a map
- Drawing contours
- Customize labelbar size
- Use overlay
- Add text
2019-02-05 kmf
'''
from __future__ import print_function
import xarray as xr
import numpy as np
import Ngl, os
#----------------------------------------------------------------------
# Based on add_lon_labels from PyNGL example spaghetti.py.
# -- The labels won't fit perfectly when mpCenterLonF is used.
#----------------------------------------------------------------------
# This procedure adds longitude labels to the outside of a circular
# polar stereographic map.
#----------------------------------------------------------------------
def add_lon_labels(wks,map,res):
#-- List the longitude values where you want labels. It's assumed that longitude=0
#-- is at the bottom of the plot, and 180W at the top. You can adjust as necessary.
lon_values = np.arange(-180,180,30)
nlon = lon_values.shape[0]
lat_values = np.zeros(nlon,'f') + res.mpMinLatF
#-- Get the NDC coordinates of these lat,lon labels. We'll use this information
#-- to place labels *outside* of the map plot.
xndc, yndc = Ngl.datatondc(map,lon_values,lat_values)
#-- Set an array of justification strings to use with the "txJust" resource
#-- for each label, based on which quadrant it appears in.
just_strs = ["BottomCenter", #-- top of plot
"BottomRight","BottomRight", #-- upper left quadrant
"CenterRight", #-- left of plot
"TopRight","TopRight", #-- lower left quadrant
"TopCenter", #-- bottom of plot
"TopLeft","TopLeft", #-- lower right quadrant
"CenterLeft", #-- right of plot
"BottomLeft","BottomLeft"] #-- upper right qudrant
#-- Create an array of longitude labels with "W" and "E" added.
lon_labels = []
for i in range(nlon):
if lon_values[i] == -180:
lon_labels.append("{:g}W ~C~ ".format(abs(lon_values[i]))) #-- move the label upward
elif lon_values[i] < 0:
lon_labels.append("{:g}W ".format(abs(lon_values[i]))) #-- add W and move to the left
elif lon_values[i] > 0:
lon_labels.append(" {:g}E".format(lon_values[i])) #-- add E and move to the right
else:
lon_labels.append(" ~C~{:g}".format(lon_values[i])) #-- move label downward
#-- Loop through each label and add it.
txres = Ngl.Resources()
txres.txFontHeightF = 0.01
for i in range(nlon):
txres.txJust = just_strs[i]
Ngl.text_ndc(wks,lon_labels[i],xndc[i],yndc[i],txres)
return
#-----------------------------------------------------------------------
#-- Function: main
#-----------------------------------------------------------------------
def main():
ncarg = os.environ['NCARG_ROOT'] #-- get the content of environment variable
diri = ''.join([ncarg+'/lib/ncarg/data/cdf/']) #-- concatenate paths
fname = 'uv300.nc' #-- data file name
f = xr.open_dataset(''.join([diri,fname])) #-- open file
u = f['U'][1,:,:] #-- read zonal winds
lat = f['lat'][:] #-- read latitudes
lon = f['lon'][:] #-- read longitudes
u,lon = Ngl.add_cyclic(u,lon) #-- add cyclic point to data array and longitude
wks = Ngl.open_wks('png','plot_polar') #-- send graphics to PNG file
Ngl.define_colormap(wks,"MPL_YlGnBu") #-- define colormap
#-- base map
mpres = Ngl.Resources() #-- plot mods desired
mpres.nglDraw = False #-- don't draw until the end
mpres.nglFrame = False #-- don't automatically advance frame
mpres.nglMaximize = False #-- don't maximize the plot, we want to
#-- use viewport settings
mpres.vpXF = 0.05 #-- viewport x-position
mpres.vpYF = 0.88 #-- viewport y-position
mpres.vpWidthF = 0.8 #-- viewport width
mpres.vpHeightF = 0.8 #-- viewport height
mpres.mpProjection = 'Stereographic' #-- set projection
mpres.mpEllipticalBoundary = True #-- map projection area is limited to an ellipse
#-- inscribed within the normal rectangular
#-- perimeter of the viewport
mpres.mpDataSetName = 'Earth..4' #-- change map data set
mpres.mpDataBaseVersion = 'MediumRes' #-- choose higher map resolution
mpres.mpLimitMode = 'LatLon'
mpres.mpMaxLatF = 90. #-- maximum latitude; northern hemisphere
mpres.mpMinLatF = 30. #-- minimum latitude
mpres.mpCenterLatF = 90. #-- center latitude
mpres.pmTickMarkDisplayMode = 'Never' #-- turn off default ticmkark object, don't draw the box
map = Ngl.map(wks,mpres) #-- create base map
Ngl.draw(map) #-- draw map
add_lon_labels(wks,map,mpres) #-- add labels to map
#-- contour plot
cmap = [2,10,20,40,50,60,70,80,90,100,110]
res = Ngl.Resources() #-- plot mods desired
res.nglDraw = False #-- do not draw until the end
res.nglFrame = False #-- do not automatically advance frame
res.cnFillOn = True #-- turn contour fill on
res.cnFillColors = cmap #-- use color indices
res.cnLinesOn = False #-- turn off contour lines
res.cnLineLabelsOn = False #-- turn off contour line labels
res.cnInfoLabelOn = False #-- turn off contour line info label
res.cnLevelSelectionMode = "ManualLevels" #-- define your own contour levels
res.cnMinLevelValF = -8 #-- minimum contour value
res.cnMaxLevelValF = 28 #-- maximum contour value
res.cnLevelSpacingF = 4 #-- contour increment
res.sfXArray = lon #-- use cyclic longitude; already numpy array
res.sfYArray = lat.values #-- use latitude in numpy array
res.lbLabelFontHeightF = 0.012 #-- set labelbar font size
res.lbLeftMarginF = 0.3 #-- move labelbar to the right
res.pmLabelBarWidthF = 0.1 #-- width of labelbar
res.pmLabelBarHeightF = mpres.vpHeightF - 0.2 #-- height of labelbar
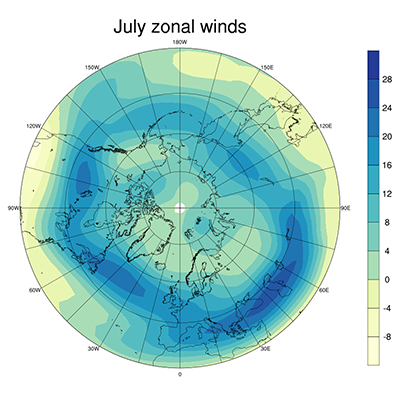
res.tiMainString = 'July zonal winds' #-- title string
plot = Ngl.contour(wks,u,res) #-- create contour plot
#-- overlay contour plot on base map
Ngl.overlay(map,plot) #-- overlay this contour on map
Ngl.draw(map) #-- draw the map
Ngl.frame(wks) #-- advance the frame
if __name__ == '__main__':
main()
Result: