PyNGL example rectilinear slice plot#
Software requirements:
Python 2.7.x
Numpy 1.9.2
PyNGL/PyNIO 1.5.0
Run the rectilinear slice contour example script:
python PyNGL_rectilinear_slice.py
Script PyNGL_rectilinear_slice.py:
'''
DKRZ PyNGL Script: PyNGL_rectilinear_slice.py
Description: Python script using PyNGL Python module
- slice plot at lat index=69 (rectilinear data)
2015-06-04 meier-fleischer(at)dkrz.de
'''
import numpy,sys,os
import Ngl,Nio
#-----------------------------------------------------------------------
#-- Function: main
#-----------------------------------------------------------------------
def main():
#-- define variables
diri = "./" #-- data directory
fname = "rectilinear_grid_3D.nc" #-- data file name
#-- open file and read variables
f = Nio.open_file(diri + fname,"r") #-- open data file
t = f.variables["t"][0,:,::-1,:] #-- first time step, reverse latitude
t70 = t[:,69,:] #-- variable at lat index 69
lev = f.variables["lev"][:] #-- all levels
lat = f.variables["lat"][::-1] #-- reverse latitudes
lon = f.variables["lon"][:] #-- all longitudes
nlat = len(lat) #-- number of latitudes
strlat70 = lat[69] #-- retrieve data of lat array index 69
#-- get the minimum and maximum of the data
minval = int(numpy.amin(t)) #-- minimum value
maxval = int(numpy.amax(t)) #-- maximum value
inc = 5 #-- contour level spacing
ncn = (maxval-minval)/inc + 1 #-- number of contour levels
#-- open a workstation
wkres = Ngl.Resources() #-- generate an res object for workstation
wkres.wkWidth = 1024 #-- plot resolution 2500 pixel width
wkres.wkHeight = 1024 #-- plot resolution 2500 pixel height
wks_type = "png" #-- output type
wks = Ngl.open_wks(wks_type,"Py_rectilinear_slice",wkres) #-- open workstation
#-- set resources
res = Ngl.Resources() #-- generate an res object for plot
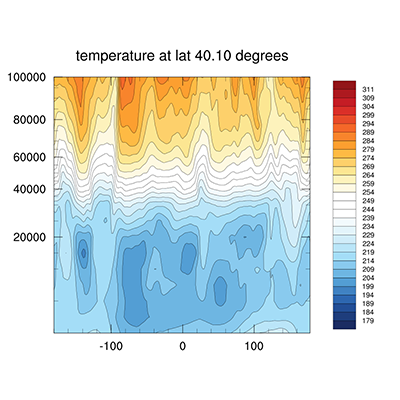
res.tiMainString = f.variables["t"].long_name + " at lat " + "{:.2f}".format(strlat70) + " degrees"
#-- set main title
#-- viewport resources
res.vpXF = 0.1 #-- start x-position of viewport
res.vpYF = 0.9 #-- start y-position of viewport
res.vpWidthF = 0.7 #-- width of viewport
res.vpHeightF = 0.7 #-- height of viewport
#-- contour resources
res.cnFillOn = True #-- turn on contour fill
res.cnLineLabelsOn = False #-- turn off line labels
res.cnInfoLabelOn = False #-- turn off info label
res.cnLevelSelectionMode = "ManualLevels" #-- select manual levels
res.cnMinLevelValF = minval #-- minimum contour value
res.cnMaxLevelValF = maxval #-- maximum contour value
res.cnLevelSpacingF = inc #-- contour increment
#-- grid resources
res.sfXArray = lon #-- scalar field x
res.sfYArray = lev #-- scalar field y
#-- labelbar resources
res.pmLabelBarDisplayMode = "Always" #-- turn off the label bar
#-- draw slice contour plot
plot = Ngl.contour(wks,t70,res)
#-- done
Ngl.end()
if __name__ == '__main__':
main()
Result: