DKRZ PyNGL example regridding with xesmf#
Example script:
#
# File:
# TRANS_regrid_xesmf_rectilinear_to_rectilinear.py
#
# Synopsis:
# Illustrates how to create a contour fill plot on a map
#
# Categories:
# contour plot
# map plot
#
# Author:
# Karin Meier-Fleischer, based on NCL example
#
# Date of initial publication:
# October 2018
#
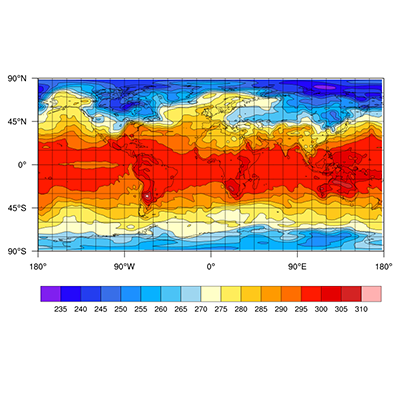
# Description:
# This example shows how to create a contour fill plot on a map.
#
# Effects illustrated:
# o Drawing a contour fill plot
# o Drawing a map
#
# Output:
# Two visualizations are produced, original data and regridded data.
#
# Notes: The data for this example can be downloaded from
# http://www.ncl.ucar.edu/Document/Manuals/NCL_User_Guide/Data/
#
'''
Transition Guide Python Example: TRANS_regrid_xesmf_rectilinear_to_rectilinear.py
- read netCDF file
- regrid to higher resolution grid
- drawing contour fill plots
- drawing a map
18-10-15 kmf
'''
from __future__ import print_function
import numpy as np
import xarray as xr
import xesmf as xe
import Ngl
#-----------------------------------------------------------------------
#-- Function: main
#-----------------------------------------------------------------------
def main():
#-- open file and read variables
data = xr.open_dataset("rectilinear_grid_3D.nc")
t = data['t'][0,0,:,:]
lat = np.array(data['lat'][:])
lon = np.array(data['lon'][:])
#-- destination lat/lon
dst_lat = np.arange(-89.5,90.5,1.0)
dst_lon = np.arange(-179.5,180.5,1.0)
#-- init destination grid
dstgrid = xr.Dataset({'lat': (['lat'], dst_lat),
'lon': (['lon'], dst_lon),})
#-- regrid
regridder = xe.Regridder(data, dstgrid, 'bilinear')
t_regrid = regridder(t)
lat_regrid = regridder(t).lat
lon_regrid = regridder(t).lon
#-- plotting
wks = Ngl.open_wks("png","plot_TRANS_regrid_xesmf_py")
res = Ngl.Resources()
res.nglFrame = False
res.cnFillOn = True
res.cnFillPalette = "NCL_default"
res.cnLineLabelsOn = False
res.cnLevelSelectionMode = "ManualLevels" #-- use manual contour line levels
res.cnMinLevelValF = 235.0 #-- contour min. value
res.cnMaxLevelValF = 310.0 #-- contour max. value
res.cnLevelSpacingF = 5.0 #-- contour interval
res.lbOrientation = "horizontal"
res.sfXArray = dst_lon
res.sfYArray = dst_lat
plot = Ngl.contour_map(wks,t_regrid,res)
Ngl.frame(wks)
res.sfXArray = lon
res.sfYArray = lat
plot = Ngl.contour_map(wks,t,res)
Ngl.frame(wks)
#-- clean-up
regridder.clean_weight_file()
#-- call main function
if __name__ == '__main__':
main()