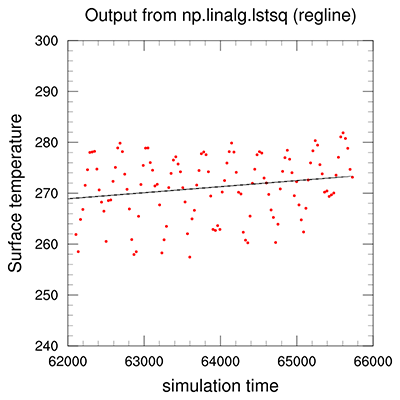
DKRZ PyNGL example scatter plot with regression line#
Example:
import numpy as np
import Ngl

#---------------------------------------------------------------
# Function runave(data, xrange): compute the running mean
#
#      Input:    data       data array
#                xrange     time range
#
#      Return:    running mean values
#---------------------------------------------------------------
def runave(data, xrange):
    return np.convolve(data, np.ones((xrange,))/xrange, mode='valid')

#---------------------------------------------------------------
# Function regline(xin,yin):      compute the regression line
#
#      Input:    xin       x array
#                yin       data array
#
#      Return:    x,y       x- and y-values of regression line
#---------------------------------------------------------------
def regline(xin,yin):
    x    = np.vstack([xin, np.ones(len(xin))]).T
    m, t = np.linalg.lstsq(x, yin, rcond=None)[0]       #-- returns gradient and y-intersection
    y    = (m*x)+t                                      #-- regression line equation
    return x, y


#-----------------------------------------------------------------------
#-- Function: main
#-----------------------------------------------------------------------
def main():

    #-- file name
    fname = 'tas_monmean_MPI-ESM-LR_rcp45_r1i1p1_20200101-20291231.nc'

    #-- open file and read variables
    a    =  Nio.open_file(fname,"r")                        #-- open data file
    tas  =  a.variables["tas"][:,:,:]                       #-- read variable tas
    lat  =  a.variables["lat"][:]                           #-- get whole "lat" variable
    lon  =  a.variables["lon"][:]                           #-- get whole "lon" variable
    time =  a.variables["time"][:]                          #-- number of timesteps
    ntime = time.size

    #-- set lat/lon point
    latval =  60                                            #-- extract lat 60N
    lonval = 180                                            #-- extract lon 180W

    #-- retrieve the indices of lat/lon point
    indlat = min(range(len(lat)), key=lambda i: abs(lat[i]-latval))
    indlon = min(range(len(lon)), key=lambda i: abs(lon[i]-lonval))

    #-- select the data of lat/lon point for all timesteps
    ts = tas[:,indlat,indlon]

    #-----------------------------------------------------------
    # Smooth data so that seasonal cycle is less prominent. This
    # is for demo purposes only so that the regression line is
    # more sloped.
    #-----------------------------------------------------------
    rmean = runave(ts,40)

    #-----------------------------------------------------------
    # Create x and calculate the regression coefficient.
    #-----------------------------------------------------------
    x, y = regline(time,ts)

    #-----------------------------------------------------------
    # Graphics
    #-----------------------------------------------------------
    wks = Ngl.open_wks("png","plot_scatter_regline")

    #-- plot resources
    res                 =  Ngl.Resources()
    res.nglDraw         =  False                    #-- don't draw plot
    res.nglFrame        =  False                    #-- don't advance the frame
    res.nglMaximize     =  True                     #-- maximize plot

    res.tiMainString    = "Output from np.linalg.lstsq (regline)" #-- add title
    res.tiXAxisString   = "simulation time"
    res.tiYAxisString   = "Surface temperature"

    res.xyMarkLineModes = "Markers"                 #-- use markers
    res.xyMarker        =  16                       #-- filled circle
    res.xyMarkerSizeF   =  0.005                    #-- default: 0.01
    res.xyMarkerColor   = "red"                     #-- marker color

    res.trYMinF         =  240
    res.trYMaxF         =  300

    #-- create xy-plot of ts
    plot0 = Ngl.xy(wks,time,ts,res)                 #-- create the xy plot

    #-- change resource settings for regression line
    res.xyMarkLineModes = "Lines"                   #-- use lines
    res.xyMarker        =  1                        #-- solid line
    res.xyMarkerColor   = "black"                   #-- marker color

    #-- create plot of regression line
    plot1 = Ngl.xy(wks,x,y,res)

    #-- overlay regression line plot on xy plot
    Ngl.overlay(plot0,plot1)

    #-- draw plot and advance the frame
    Ngl.draw(plot0)
    Ngl.frame(wks)

    Ngl.end()

if __name__ == '__main__':
    main()
Result: