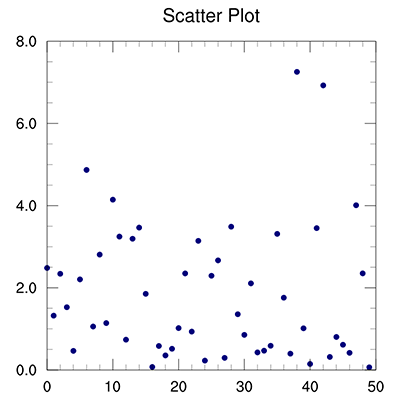
DKRZ PyNGL example scatter plot#
Example:
import numpy as np
import Ngl

#-----------------------------------------------------------------------
#-- Function: main
#-----------------------------------------------------------------------
def main():

    #-- generate random data
    t = np.random.chisquare(2.0, 50)
    np.random.seed(10)               #-- set a seed for the random number generator

    #-- open graphics output
    wks = Ngl.open_wks("png","plot_scatter_1")

    #-- set resources
    res = Ngl.Resources()
    res.nglMaximize = True #-- maximize plot

    res.tiMainString = "Scatter Plot" #-- add title

    res.xyMarkLineMode = "Markers" #-- choose to use markers
    res.xyMonoMarkLineMode = True #-- default: only one marker style
    res.xyMarkers = 16 #-- choose type of marker
    res.xyMarkerColor = "NavyBlue" #-- marker color
    res.xyMarkerSizeF = 0.01 #-- marker size (default 0.01)

    #-- draw the plot
    plot = Ngl.y(wks,t,res)

    Ngl.end()

if __name__ == '__main__':
    main()
Result: