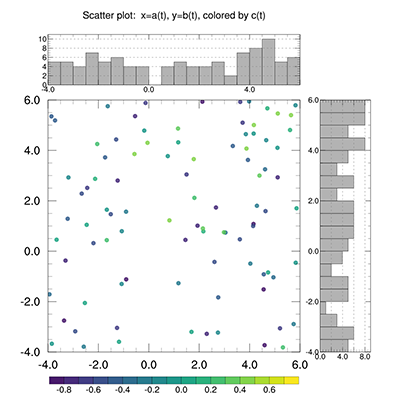
DKRZ PyNGL example scatterplot with two additional histograms attached#
Example script:
#  File:
#    scatter_plot_add_2_histograms.py
#
#  Synopsis:
#    Create a scatter plot of the data a(t), b(t) and color the
#    polymarker by the color of variable c(t). Add additional
#    histograms of the counts per selected axis range to the plot.
#
#  Category:
#    xy plot
#    polylines, polygons
#    functions
#    text
#
#  Based on DKRZ's NCL example:
#    scatter_plot_add_2_histograms.ncl
#
#  Author:
#    Karin Meier-Fleischer
#
#  Date of initial publication:
#    December, 2018
#
#  Description:
#    Create a scatter plot of the data a(t), b(t) and color the
#    polymarker by the color of variable c(t). Add additional
#    histograms of the counts per selected axis range to the plot.#
#
#  Effects illustrated:
#    o  Create an xy-plot
#    o  Define functions
#    o  Add polymarker, polylines, and polygons
#    o  Add text
#
#  Output:
#     One visualization is produced.
#
'''
  PyNGL Example:     scatter_plot_add_2_histograms.py

  -  Create an xy-plot
  -  Define functions
  -  Add polymarker, polylines, and polygons
  -  Add text
'''
import numpy as np
import Ngl

#----------------------------------------------------------------------
# Procedure add_histogram: attach a to the plot
#----------------------------------------------------------------------
def add_histogram(wks, plot, data, levels, opt):

#-- retrieve viewport width and height
   vpx = Ngl.get_float(plot,"vpXF")                 #-- retrieve plot x-position
   vpy = Ngl.get_float(plot,"vpYF")                 #-- retrieve plot y-position
   vpw = Ngl.get_float(plot,"vpWidthF")             #-- retrieve plot width
   vph = Ngl.get_float(plot,"vpHeightF")            #-- retrieve plot height

   if(opt):
      if(hasattr(opt,'orientation')):
         if(opt.orientation == 'horizontal'):
            w    =  vpw
            h    =  0.2*vph
            ampa = -0.50
            amor = -0.66
         else:
            opt.orientation == 'vertical'
            h    = vph
            w    = 0.2*vpw
            ampa = 0.58
            amor = 0.0

      if(hasattr(opt,'numLevels')):
         nt = opt.numLevels
      else:
         nt = 10

      if(hasattr(opt,'xRange')):
         min1d = opt.xRange[0]
         max1d = opt.xRange[1]
      else:
         min1d = min(data)
         max1d = max(data)

   hist_levels = np.linspace(min1d, max1d,nt+1)

#-- get the values (counts) for the bars
   count = []
   for i in range(0,len(hist_levels)-1):
      xind  = Ngl.ind(np.logical_and(data >= hist_levels[i], data < hist_levels[i+1]))
      count.append(len(xind))

#-- set resources
   hres                             = Ngl.Resources()
   hres.nglDraw                     = False
   hres.nglFrame                    = False

   if(opt.orientation == "horizontal"):
      hres.vpWidthF                    =  w
      hres.vpHeightF                   =  h
      hres.tmYMajorGrid                =  True
      hres.tmYMajorGridLineColor       = "gray50"
      hres.tmYMajorGridLineDashPattern =  2
      hres.trXMinF                     =  min1d
      hres.trXMaxF                     =  max1d
      hres.trYMinF                     =  0
      hres.trYMaxF                     =  max(count)+1

   elif(opt.orientation == "vertical"):
      hres.vpWidthF                    =  w
      hres.vpHeightF                   =  h
      hres.tmXMajorGrid                =  True
      hres.tmXMajorGridLineColor       = "gray50"
      hres.tmXMajorGridLineDashPattern =  2
      hres.trXMinF                     =  0
      hres.trXMaxF                     =  max(count)+1
      hres.trYMinF                     =  min1d
      hres.trYMaxF                     =  max1d

   hres.tmXBLabelFontHeightF        =  0.014
   hres.tmYLLabelFontHeightF        =  0.014
   hres.tmXBLabelStride             =  2
   hres.tmXBLabelDeltaF             = -0.7
   hres.tmYLLabelDeltaF             = -0.7
   hres.tmLabelAutoStride           =  True         #-- use nice tick mark labels

   histo = Ngl.blank_plot(wks, hres)                #-- create blank plot

#-- set resources for the polylines
   polyres                   =  Ngl.Resources()     #-- set up defaults
   polyres.gsLineColor       = 'black'              #-- color of lines
   polyres.gsFillColor       = 'gray70'             #-- color of lines
   polyres.gsLineThicknessF  =  1.5                 #-- thickness of lines
   polyres.gsLineDashPattern =  0

#-- compute the x- and y-values for the bars and create polygons and polylines
   plid = []
   pgid = []
   for i in range(0,len(hist_levels)-1):
      if(opt.orientation == 'horizontal'):
         x = [hist_levels[i], hist_levels[i+1], hist_levels[i+1], hist_levels[i], hist_levels[i]]
         y = [0,0,count[i],count[i],0]
      elif(opt.orientation == 'vertical'):
         y = [hist_levels[i], hist_levels[i+1], hist_levels[i+1], hist_levels[i], hist_levels[i]]
         x = [0,0,count[i],count[i],0]
      pgid.append(Ngl.add_polygon(wks,histo,x,y,polyres))   #-- add polygon to histo
      plid.append(Ngl.add_polyline(wks,histo,x,y,polyres))  #-- add polyline to histo

#-- attach histogram to plot
   amres                  =  Ngl.Resources()
   amres.amJust           = "CenterLeft"
   amres.amParallelPosF   =  ampa
   amres.amOrthogonalPosF =  amor
   annoidpg = Ngl.add_annotation(plot,histo,amres)

   return(plot)

#----------------------------------------------------------------------
# Procedure add_labelbar: attach a vertical labelbar to the right
#                         side of the plot
#----------------------------------------------------------------------
def add_labelbar(wks,plot,colors,levels, orient):
#-- retrieve viewport width and height
   vpx = Ngl.get_float(plot,"vpXF")             #-- retrieve plot x-position
   vpy = Ngl.get_float(plot,"vpYF")             #-- retrieve plot y-position
   vpw = Ngl.get_float(plot,"vpWidthF")         #-- retrieve plot width
   vph = Ngl.get_float(plot,"vpHeightF")        #-- retrieve plot height

   if(orient == "horizontal"):
      vw   = vpw
      vh   = 0.1*vph
      ampa = -0.5
      amor = 0.63
   elif(orient == "vertical"):
      vw   = 0.15*vpw
      vh   = 0.99*vph
      ampa = 0.55
      amor = 0.0

#-- define labels and retrieve the number of color boxes
   labels = levels.astype('str')                #-- convert to type string
   nboxes = len(colors[:,0])                    #-- number of color boxes (nlevels+1)

#-- create labelbar
   lbres                    =  Ngl.Resources()  #-- labelbar only resources
   lbres.vpWidthF           =  vw               #-- labelbar width
   lbres.vpHeightF          =  vh               #-- labelbar height
   lbres.nglDraw            =  False

   lbres.lbAutoManage       =  False            #-- Necessary to control sizes
   lbres.lbFillColors       =  colors           #-- labelbar colors
   lbres.lbMonoFillPattern  =  True             #-- Solid fill pattern
   lbres.lbLabelFontHeightF =  0.016            #-- font height. default is small
   lbres.lbLabelAlignment   = "InteriorEdges"   #-- line of box
   lbres.lbOrientation      =  orient
   lbres.lbPerimOn          =  False

   lbid = Ngl.labelbar_ndc(wks,nboxes,list(labels),0.1,0.5,lbres)

#-- attach labelbar to the plot
   amres                  =  Ngl.Resources()
   amres.amJust           = "CenterLeft"
   amres.amParallelPosF   =  ampa
   amres.amOrthogonalPosF =  amor

   annoid = Ngl.add_annotation(plot,lbid,amres)

#-----------------------------------------------------------------------
#-- Function: main
#-----------------------------------------------------------------------
def main():

    #-- set minimum, maximum and interval value to group the data to color and create the labelbar
    cmin =  -0.8
    cmax =   0.8
    cint =   0.01
    nt   = 100                                      #-- number of data per array

    #-- x-,y-data
    min1d = -4.0
    max1d =  6.0
    hist_levels = np.linspace(min1d, max1d,22)

    #-- generate random data 100 points (e.g. time steps) data for x-axis
    a = np.random.uniform(min1d,max1d,nt)

    #-- data for y-axis
    b = np.random.uniform(min1d,max1d,nt)

    #-- data for coloring
    c = np.random.uniform(cmin,cmax,nt)

    #-- title string
    title = "Scatter plot:  x=a(t), y=b(t), colored by c(t)"

    #-- set colormap name
    colmap = "MPL_viridis"                          #-- colormap blue-green,yellow

    #-- define levels for labelbar and colors
    levels1 =  np.arange(np.ceil(cmin*10),np.floor(cmax*10),1)/10.0  #-- define levels
    levels2 =  np.arange(np.ceil(cmin*10),np.floor(cmax*10),1)/10.0  #-- define levels
    nlevels =  levels1.size                         #-- number of levels

    #-- open workstation
    wks_type = "png"
    wksres          = Ngl.Resources()
    wksres.wkWidth  = 1200
    wksres.wkHeight = 1200
    wks  = Ngl.open_wks(wks_type,"plot_scatter_attach_two_histograms",wksres)
    Ngl.define_colormap(wks,colmap)

    #-- retrieve the colors# don't use the first dark blues
    colors  =  Ngl.retrieve_colormap(wks)           #-- retrieve color map
    colind  =  np.linspace(20,255,nlevels+1).astype('int') #-- don't use first 20 colors
    colors  =  colors[colind,:]
    ncolors =  len(colors)

    #-- resources
    res                   =  Ngl.Resources()        #-- plot mods desired
    res.nglDraw           =  False                  #-- don't draw plot, yet
    res.nglFrame          =  False                  #-- don't advance frame, yet

    res.trYMinF           =  min1d                  #-- y-axis minimum to have enough space for legend
    res.trYMaxF           =  max1d                  #-- y-axis maximum
    res.trXMinF           =  min1d                  #-- y-axis minimum to have enough space for legend
    res.trXMaxF           =  max1d                  #-- y-axis maximum

    res.tmLabelAutoStride =  True                   #-- use nice tick mark labels

    res.vpWidthF          =  0.63                   #-- viewport width
    res.vpHeightF         =  0.63                   #-- viewport height
    res.vpXF              =  0.12                   #-- viewport x-position
    res.vpYF              =  0.75                   #-- viewport y-position

    #-- create blank plot
    plot = Ngl.blank_plot(wks, res)

    #-- group data and add it as filled circle markers, slightly transparent
    mres                    =  Ngl.Resources()
    mres.gsMarkerThicknessF =  2.5                  #-- marker thickness
    mres.gsMarkerOpacityF   =  0.8                  #-- marker opacity

    pltmarker = []
    for i in range(0,nlevels-2):
       ii = Ngl.ind(np.logical_and(levels1[i] <= c, levels1[i+1] > c))
       mres.gsMarkerIndex  =  16                    #-- filled circle marker
       mres.gsMarkerSizeF  =  0.01                  #-- marker size
       mres.gsMarkerColor  =  colors[i,:]           #-- marker color
       pltmarker.append(Ngl.add_polymarker(wks,plot,a[ii],b[ii],mres)) #-- add marker

    #-- add labelbar
    add_labelbar(wks,plot,colors,levels1,'horizontal')

    #-- special histogram resources for function add_histogram
    opt             =  Ngl.Resources()
    opt.numLevels   =  20                           #-- number of levels
    opt.barColor    = 'gray60'                      #-- fill color
    opt.xRange      = [min1d,max1d]                 #-- x-axis range

    #-- add histogram at the top
    opt.orientation = 'horizontal'
    pltid1 = add_histogram(wks, plot, a, levels1, opt)

    #-- add histogram at the right side
    opt.orientation = 'vertical'
    pltid2 = add_histogram(wks, plot, b, levels2, opt)

    #-- write title to plot
    title = "Scatter plot:  x=a(t), y=b(t), colored by c(t)"

    txres               =  Ngl.Resources()
    txres.txJust        = 'CenterCenter'
    txres.txFontHeightF =  0.018
    xx = Ngl.get_float(plot,'vpXF')+Ngl.get_float(plot,'vpWidthF')/2
    Ngl.text_ndc(wks,title,xx,0.96,txres)

    #-- draw the plot and advance the frame
    Ngl.draw(plot)
    Ngl.frame(wks)

#-- call  main function
if __name__ == '__main__':
    main()
Result: