DKRZ PyNGL example shapefile use#
Example script:
#
# File:
# TRANS_shapefile.py
#
# Synopsis:
# Illustrates how to use shapefiles
#
# Categories:
# map plot
# contour plot
# shapefiles
#
# Author:
# Karin Meier-Fleischer, based on NCL example
#
# Date of initial publication:
# September 2018
#
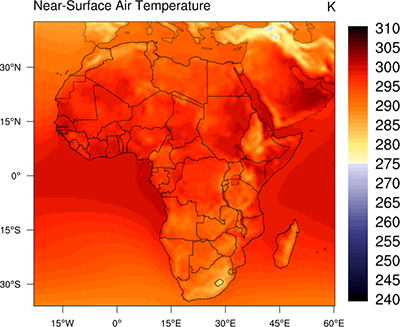
# Description:
# This example shows how to use shapefiles.
#
# Effects illustrated:
# o Reading netCDF data
# o Drawing contours on a map
# o Using manual levels
# o Reading shapefile content
# o Drawing shapefile polylines
#
# Output:
# A single visualization is produced.
#
# Notes: The data for this example can be downloaded from
# http://www.ncl.ucar.edu/Document/Manuals/NCL_User_Guide/Data/
#
'''
Transition Guide Python Example: TRANS_shapefile.py
- Reading netCDF data
- Drawing contours on a map
- Using manual levels
- Reading shapefile content
- Drawing shapefile polylines
18-09-11 kmf
'''
from __future__ import print_function
import numpy as np
import Ngl, Nio
#-----------------------------------------------------------------------
#-- Function: main
#-----------------------------------------------------------------------
def main():
#-- open file and read variables
f = Nio.open_file("tas.nc", "r")
var = f.variables["tas"][0,0,:,:]
lat = f.variables["rlat"][:]
lon = f.variables["rlon"][:]
#-- start the graphics
wks = Ngl.open_wks("png","plot_TRANS_shapefile_py")
#-- resource settings
res = Ngl.Resources()
res.nglFrame = False #-- don't advance frame
res.nglDraw = False #-- don't draw plot
res.cnFillOn = True
res.cnFillPalette = "NCL_BYR-03" #-- choose color map
res.cnLinesOn = False
res.cnLineLabelsOn = False
res.cnLevelSelectionMode = "ManualLevels" #-- set levels
res.cnMinLevelValF = 240.0 #-- minimum contour level
res.cnMaxLevelValF = 310.0 #-- maximum contour level
res.cnLevelSpacingF = 0.5 #-- contour level spacing
res.cnFillMode = "RasterFill" #-- turn on contour fill
res.lbBoxLinesOn = False #-- turn off labelbar box lines
res.lbLabelStride = 10 #-- skip every other label
res.lbBoxMinorExtentF = 0.24 #-- decrease height of labelbar box
res.pmLabelBarOrthogonalPosF = -0.05 #-- move labelbar upward
res.mpLimitMode = "LatLon"
res.mpMinLatF = -36.0
res.mpMaxLatF = 42.6
res.mpMinLonF = -23.0
res.mpMaxLonF = 60.3
res.mpGridAndLimbOn = False #-- don't draw grid lines
res.sfXArray = lon
res.sfYArray = lat
#-- create the contour plot
plot = Ngl.contour_map(wks,var,res)
#-- read shapefile contents
shpf = Nio.open_file("act4567/country.shp", "r") #-- open shapefile
lon = np.ravel(shpf.variables["x"][:])
lat = np.ravel(shpf.variables["y"][:])
segments = shpf.variables["segments"][:,0]
#-- polyline resource settings
plres = Ngl.Resources() #-- resources for polylines
plres.gsLineColor = "black"
plres.gsSegments = segments
#-- add shapefile polylines to the plot
id = Ngl.add_polyline(wks, plot, lon, lat, plres)
#-- write variable long_name and units to the plot
txres = Ngl.Resources()
txres.txFontHeightF = 0.022
Ngl.text_ndc(wks,f.variables["tas"].attributes['long_name'],0.30,0.88,txres)
Ngl.text_ndc(wks,f.variables["tas"].attributes['units'], 0.78,0.88,txres)
#-- advance the frame
Ngl.draw(plot)
Ngl.frame(wks)
Ngl.end()
#-- call main function
if __name__ == '__main__':
main()