PyNGL example vector plots#
Software requirements:
Python 2.7.x
Numpy 1.9.2
PyNGL/PyNIO 1.5.0
Run the vector example script:
python PyNGL_vector_rectilinear.py
Script PyNGL_vector_rectilinear.py:
'''
DKRZ PyNGL Script: PyNGL_vector_rectilinear.py
Description: Python script using PyNGL Python module
- vector plot on map (rectilinear data)
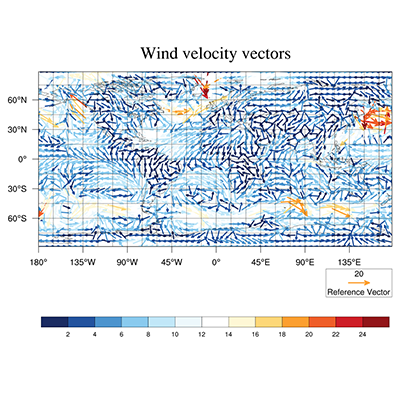
1st plot : vectors on global map, colored
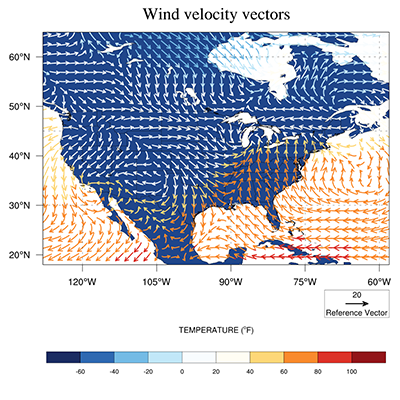
2nd plot : vectors colored by temperature
- curly vectors
2015-06-04 meier-fleischer(at)dkrz.de
'''
import numpy, os
import Ngl, Nio
#-----------------------------------------------------------------------
#-- Function: main
#-----------------------------------------------------------------------
def main():
#-- define variables
diri = "$HOME/NCL/general/data/new_data/" #-- data directory
fname = "rectilinear_grid_2D.nc" #-- data file name
minval = 250. #-- minimum contour level
maxval = 315 #-- maximum contour level
inc = 5. #-- contour level spacing
#-- open file and read variables
f = Nio.open_file(diri + fname,"r") #-- open data file
temp = f.variables["tsurf"][0,::-1,:] #-- first time step, reverse latitude
u = f.variables["u10"][0,::-1,:] #-- first time step, reverse latitude
v = f.variables["v10"][0,::-1,:] #-- first time step, reverse latitude
lat = f.variables["lat"][::-1] #-- reverse latitudes
lon = f.variables["lon"][:] #-- all longitudes
nlon = len(lon) #-- number of longitudes
nlat = len(lat) #-- number of latitudes
#-- open a workstation
wkres = Ngl.Resources() #-- generate an resources object for workstation
wkres.wkWidth = 1024 #-- plot resolution 2500 pixel width
wkres.wkHeight = 1024 #-- plot resolution 2500 pixel height
wks_type = "png" #-- graphics output type
wks = Ngl.open_wks(wks_type,"Py_rectilinear_vector",wkres)
#-- create 1st plot: vectors on global map
res = Ngl.Resources()
res.vfXCStartV = float(lon[0]) #-- minimum longitude
res.vfXCEndV = float(lon[len(lon[:])-1]) #-- maximum longitude
res.vfYCStartV = float(lat[0]) #-- minimum latitude
res.vfYCEndV = float(lat[len(lat[:])-1]) #-- maximum latitude
res.tiMainString = "~F25~Wind velocity vectors" #-- title string
res.tiMainFontHeightF = 0.024 #-- decrease title font size
res.mpLimitMode = "Corners" #-- select a sub-region
res.mpLeftCornerLonF = float(lon[0]) #-- left longitude value
res.mpRightCornerLonF = float(lon[len(lon[:])-1]) #-- right longitude value
res.mpLeftCornerLatF = float(lat[0]) #-- left latitude value
res.mpRightCornerLatF = float(lat[len(lat[:])-1]) #-- right latitude value
res.mpPerimOn = True #-- turn on map perimeter
res.vpXF = 0.1 #-- viewport x-position
res.vpYF = 0.92 #-- viewport y-position
res.vpWidthF = 0.75 #-- viewport width
res.vpHeightF = 0.75 #-- viewport height
res.vcMonoLineArrowColor = False #-- draw vectors in color
res.vcMinFracLengthF = 0.33 #-- increase length of vectors
res.vcMinMagnitudeF = 0.001 #-- increase length of vectors
res.vcRefLengthF = 0.045 #-- set reference vector length
res.vcRefMagnitudeF = 20.0 #-- set reference magnitude value
res.vcLineArrowThicknessF = 6.0 #-- make vector lines thicker (default: 1.0)
res.pmLabelBarDisplayMode = "Always" #-- turn on a labelbar
res.lbOrientation = "Horizontal" #-- labelbar orientation
res.lbLabelFontHeightF = 0.008 #-- labelbar label font size
res.lbBoxMinorExtentF = 0.22 #-- decrease height of labelbar boxes
#-- draw first plot
map1 = Ngl.vector_map(wks,u[::3,::3],v[::3,::3],res) #-- draw a vector plot
#-- create 2nd plot: sub-region colored by temperature variable
tempa = (temp-273.15)*9.0/5.0+32.0 #-- convert from Kelvin to Fahrenheit
res.mpLimitMode = "LatLon" #-- change the area of the map
res.mpMinLatF = 18.0 #-- minimum latitude
res.mpMaxLatF = 65.0 #-- maximum latitude
res.mpMinLonF = -128. #-- minimum longitude
res.mpMaxLonF = -58. #-- minimum longitude
res.mpFillOn = True #-- turn on map fill
res.mpLandFillColor = 16 #-- change land color to grey
res.mpOceanFillColor = -1 #-- change color for oceans and inlandwater
res.mpInlandWaterFillColor = -1 #-- set ocean/inlandwater color to transparent
res.mpGridMaskMode = "MaskNotOcean" #-- draw grid over ocean, not land
res.mpGridLineDashPattern = 2 #-- grid dash pattern
res.mpOutlineBoundarySets = "GeophysicalAndUSStates" #-- outline US States
res.vcFillArrowsOn = True #-- fill the vector arrows
res.vcMonoFillArrowFillColor = False #-- draw vectors with colors
res.vcFillArrowEdgeColor = 1 #-- draw the edges in black
res.vcGlyphStyle = "CurlyVector" #-- draw nice curly vectors
res.vcLineArrowThicknessF = 5.0 #-- make vector lines thicker (default: 1.0)
res.tiMainString = "~F25~Wind velocity vectors" #-- title string
res.lbTitleString = "TEMPERATURE (~S~o~N~F)" #-- labelbar title string
res.lbTitleFontHeightF = 0.010 #-- labelbar title font size
res.lbBoxMinorExtentF = 0.18 #-- decrease height of labelbar boxes
#-- draw 2nd plot
map2 = Ngl.vector_scalar_map(wks,u[::1,::1],v[::1,::1],tempa[::1,::1],res)
#-- done
Ngl.end()
if __name__ == '__main__':
main()
Result: