PyNGL example xy-plot#
Software requirements:
Python 2 or 3
Numpy
PyNGL 1.6.1
Run the xy-plot example script:
python PyNGL_xy_plot.py
Script PyNGL_xy_plot.py:
'''
DKRZ PyNGL Script: PyNGL_xy_plot.py
Description: simple xy-plot
11.05.15 meier-fleischer(at)dkrz.de
'''
import numpy, os
import Ngl
#-----------------------------------------------------------------------
#-- Function: main
#-----------------------------------------------------------------------
def main():
import numpy
import Ngl
#-- define x and y variables
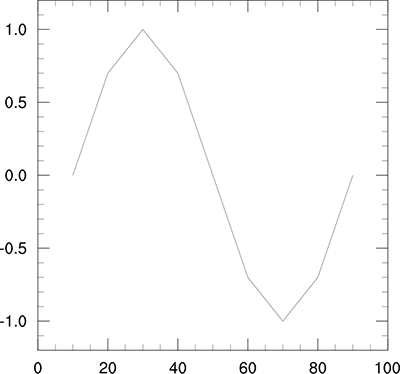
x = [10., 20., 30., 40., 50., 60., 70., 80., 90.]
y = numpy.array([0., 0.7, 1., 0.7, 0., -0.7, -1., -0.7, 0.],'f')
#-- open a workstation
wkres = Ngl.Resources()
wks = Ngl.open_wks("png","plot_xy_0_py",wkres)
#-- set resources
res = Ngl.Resources() #-- generate an res object for plot
#-- draw the plot
plot = Ngl.xy(wks,x,y,res)
#-- done
Ngl.end()
if __name__ == '__main__':
main()
Result: