DKRZ PyNGL Hovmoeller plot with filled contours#
Example script:
#
# File:
# hov_5.py
#
# Synopsis:
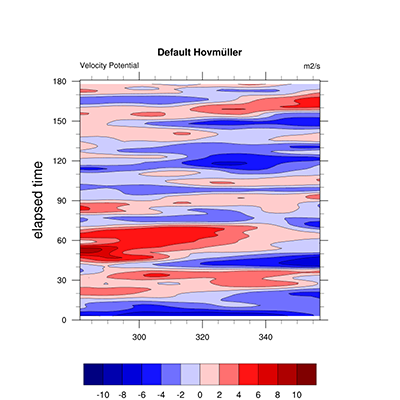
# Default black and white Hovmueller plot.
#
# Category:
# contour plot
#
# Based on NCL example:
# hov_5.ncl
#
# Author:
# Karin Meier-Fleischer
#
# Date of initial publication:
# November, 2018
#
# Description:
# This example shows how to create a default black and white Hovmueller plot.
#
# Effects illustrated:
# o Creating a Hovmueller plot
# o Using text function codes to generate umlauts
# o Using contour fill
#
# Output:
# A single visualization is produced.
#
'''
PyNGL Example: hov_5.py
- Creating a Hovmueller plot
- Using text function codes to generate umlauts
- Using contour fill
'''
from __future__ import print_function
import numpy as np
import os, sys
import Ngl,Nio
#-------------------------------------------------------
#-- Function: add_titles(wks,plot,resources,title,left,center,right)
#-------------------------------------------------------
def add_titles(wks,plot,title="",left="",center="",right=""):
vpx = Ngl.get_float(plot,"vpXF") #-- retrieve value of res.vpXF from plot
vpy = Ngl.get_float(plot,"vpYF") #-- retrieve value of res.vpYF from plot
vpw = Ngl.get_float(plot,"vpWidthF") #-- retrieve value of res.vpWidthF from plot
vph = Ngl.get_float(plot,"vpHeightF") #-- retrieve value of res.vpHeightF from plot
ymax = vpy+0.08 #-- we need space for the title and strings
if(ymax > 0.98):
print("--> if you can't see the title use res.nglMaximize = False and/or set res.vpYF")
#-- add title
if(title != ""):
tires = Ngl.Resources()
tires.txFontHeightF = 0.018
tires.txJust = "CenterCenter"
tires.txFont = 22 #-- Font 22: Helvetica bold
if(left != "" or center != "" or right != ""):
y = vpy + 0.07
else:
y = vpy + 0.05
Ngl.text_ndc(wks, title, 0.5, y, tires)
#-- add left, center and/or right string
txres = Ngl.Resources()
txres.txFontHeightF = 0.014 #-- font size for left, center and right string
y = vpy + 0.035 #-- y-position
if(left != ""):
txres.txJust = "CenterLeft" #-- text justification
x = vpx #-- x-position
Ngl.text_ndc(wks, left, x, y, txres) #-- add text to wks
if(center != ""):
txres.txJust = "CenterCenter" #-- text justification
Ngl.text_ndc(wks, center, 0.5, y, txres) #-- add text to wks
if(right != ""):
txres.txJust = "CenterRight" #-- text justification
x = vpx+vpw #-- x-position
Ngl.text_ndc(wks, right, x, y, txres) #-- add text to wks
#-----------------------------------------------------------------------
#-- Function: main
#-----------------------------------------------------------------------
def main():
#-- data path and file name
ncarg_root = os.environ.get('NCARG_ROOT')
diri = ncarg_root + '/lib/ncarg/data/cdf/'
fname = 'chi200_ud_smooth.nc'
#-- open file and read variables
f = Nio.open_file(diri + fname,"r") #-- open data file
chi = f.variables['CHI'][:,:] #-- read variable CHI[time,lon]
lon = f.variables['lon'][:]
time = f.variables['time'][:]
scale = 1.0e6
chi = chi/scale
#-- create the plot
wks = Ngl.open_wks('png','plot_hovmueller_5')
#-- open workstation
#-- set resources
res = Ngl.Resources
res.nglFrame = False
res.nglMaximize = False #-- don't maximize plot output, yet
res.cnFillOn = True #-- turn on color fill
res.cnFillPalette = "BlWhRe" #-- set color map
res.cnLineLabelsOn = False
res.cnLevelSelectionMode = "ManualLevels" #-- manual contour levels
res.cnMinLevelValF = -10. #-- min level
res.cnMaxLevelValF = 10. #-- max level
res.cnLevelSpacingF = 2. #-- contour level spacing
res.lbOrientation = "horizontal" #-- horizontal labelbar
res.sfXArray = lon[100:220] #-- scalar field x
res.sfYArray = time #-- scalar field y
res.tiYAxisString = 'elapsed time'
res.tmYLLabelFontHeightF = 0.015
res.nglPointTickmarksOutward = True #-- point tickmarks out
plot = Ngl.contour(wks,chi[:,100:220],res) #-- draw contours
#-- delete resources because they will cause warnings (Why?)
del([res.sfXArray,res.sfYArray,res.cnFillOn,res.cnFillPalette,res.cnLevelSelectionMode,\
res.cnLevelSpacingF,res.cnLineLabelsOn,res.cnMaxLevelValF,res.cnMinLevelValF,\
res.lbOrientation,res.tiYAxisString,res.tmYLLabelFontHeightF])
#-- add the title and left, center and/or right string
title = "Default Hovmu~H-13V2F35~H~FV-2H3~ller"
long_name = f.variables["CHI"].attributes['long_name']
units = f.variables["CHI"].attributes['units']
add_titles(wks,plot,title,left=long_name,right=units)
#-- advance the frame
Ngl.frame(wks)
#-- end
Ngl.end()
if __name__ == '__main__':
main()
Result: