DKRZ PyNGL map tickmark example mask Lambert Conformal projection#
Example script:
#
# File:
# mptick_10.py
#
# Synopsis:
# Demonstrates how to mask Lambert Conformal Projection map.
# Shows how to add your own longitude/latitude labels to a
# masked Lambert Conformal plot.
#
# Categories:
# map plot
#
# Based on NCL example:
# mptick_10.ncl
#
# Author:
# Karin Meier-Fleischer
#
# Date of initial publication:
# November 2018
#
# Description:
# This example shows how to create a map.
#
# Effects illustrated:
# o Adding longitude/latitude labels to a masked Lambert Conformal map
# o Moving the main title up
# o Attaching text strings to the outside of a plot
# o Converting lat/lon values to NDC values
# o Changing the angle of text strings
# o Adding a carriage return to a text string using a function code
#
# Output:
# Two visualizations are produced.
#
'''
PyNGL Example: mptick_10.py
- Adding longitude/latitude labels to a masked Lambert Conformal map
- Moving the main title up
- Attaching text strings to the outside of a plot
- Converting lat/lon values to NDC values
- Changing the angle of text strings
- Adding a carriage return to a text string using a function code
'''
from __future__ import print_function
import numpy as np
import Ngl
#-------------------------------------------------------
# Function to attach lat/lon labels to a Robinson plot
#-------------------------------------------------------
def add_labels_lcm(wks,map,dlat,dlon):
PI = 3.14159
RAD_TO_DEG = 180./PI
#-- determine whether we are in northern or southern hemisphere
if (float(minlat) >= 0. and float(maxlat) > 0.):
HEMISPHERE = "NH"
else:
HEMISPHERE = "SH"
#-- pick some "nice" values for the latitude labels.
lat_values = np.arange(int(minlat),int(maxlat),10)
lat_values = lat_values.astype(float)
nlat = len(lat_values)
#-- We need to get the slope of the left and right min/max longitude lines.
#-- Use NDC coordinates to do this.
lat1_ndc = 0.
lon1_ndc = 0.
lat2_ndc = 0.
lon2_ndc = 0.
lon1_ndc,lat1_ndc = Ngl.datatondc(map,minlon,lat_values[0])
lon2_ndc,lat2_ndc = Ngl.datatondc(map,minlon,lat_values[nlat-1])
slope_lft = (lat2_ndc-lat1_ndc)/(lon2_ndc-lon1_ndc)
lon1_ndc,lat1_ndc = Ngl.datatondc(map,maxlon,lat_values[0])
lon2_ndc,lat2_ndc = Ngl.datatondc(map,maxlon,lat_values[nlat-1])
slope_rgt = (lat2_ndc-lat1_ndc)/(lon2_ndc-lon1_ndc)
#-- set some text resources
txres = Ngl.Resources()
txres.txFontHeightF = 0.01
txres.txPosXF = 0.1
#-- Loop through lat values, and attach labels to the left and right edges of
#-- the masked LC plot. The labels will be rotated to fit the line better.
dum_lft = [] #-- assign arrays
dum_rgt = [] #-- assign arrays
lat_label_lft = [] #-- assign arrays
lat_label_rgt = [] #-- assign arrays
for n in range(0,nlat):
#-- left label
if(HEMISPHERE == "NH"):
rotate_val = -90.
direction = "N"
else:
rotate_val = 90.
direction = "S"
#-- add extra white space to labels
lat_label_lft.append("{}~S~o~N~{} ".format(str(np.abs(lat_values[n])),direction))
lat_label_rgt.append(" {}~S~o~N~{}".format(str(np.abs(lat_values[n])),direction))
txres.txAngleF = RAD_TO_DEG * np.arctan(slope_lft) + rotate_val
dum_lft.append(Ngl.add_text(wks,map,lat_label_lft[n],minlon,lat_values[n],txres))
#-- right label
if(HEMISPHERE == "NH"):
rotate_val = 90
else:
rotate_val = -90
txres.txAngleF = RAD_TO_DEG * np.arctan(slope_rgt) + rotate_val
dum_rgt.append(Ngl.add_text(wks,map,lat_label_rgt[n],maxlon,lat_values[n],txres))
#----------------------------------------------------------------------
# Now do longitude labels. These are harder because we're not adding
# them to a straight line.
# Loop through lon values, and attach labels to the bottom edge for
# northern hemisphere, or top edge for southern hemisphere.
#----------------------------------------------------------------------
del(txres.txPosXF)
txres.txPosYF = -5.0
#-- pick some "nice" values for the longitude labels
lon_values = np.arange(int(minlon+10),int(maxlon-10),10).astype(float)
lon_values = np.where(lon_values > 180, 360-lon_values, lon_values)
nlon = lon_values.size
dum_bot = [] #-- assign arrays
lon_labels = [] #-- assign arrays
if(HEMISPHERE == "NH"):
lat_val = minlat
else:
lat_val = maxlat
ctrl = "~C~"
for n in range(0,nlon):
if(lon_values[n] < 0):
if(HEMISPHERE == "NH"):
lon_labels.append("{}~S~o~N~W{}".format(str(np.abs(lon_values[n])),ctrl))
else:
lon_labels.append("{}{}~S~o~N~W".format(ctrl,str(np.abs(lon_values[n]))))
elif(lon_values[n] > 0):
if(HEMISPHERE == "NH"):
lon_labels.append("{}~S~o~N~E{}".format(str(lon_values[n]),ctrl))
else:
lon_labels.append("{}{}~S~o~N~E".format(ctrl,str(lon_values[n])))
else:
if(HEMISPHERE == "NH"):
lon_labels.append("{}0~S~o~N~{}".format(ctrl,ctrl))
else:
lon_labels.append("{}0~S~o~N~{}".format(ctrl,ctrl))
#-- For each longitude label, we need to figure out how much to rotate
#-- it, so get the approximate slope at that point.
if(HEMISPHERE == "NH"): #-- add labels to bottom of LC plot
lon1_ndc,lat1_ndc = Ngl.datatondc(map, lon_values[n]-0.5, minlat)
lon2_ndc,lat2_ndc = Ngl.datatondc(map, lon_values[n]+0.5, minlat)
txres.txJust = "TopCenter"
else: #-- add labels to top of LC plot
lon1_ndc,lat1_ndc = Ngl.datatondc(map, lon_values[n]+0.5, maxlat)
lon2_ndc,lat2_ndc = Ngl.datatondc(map, lon_values[n]-0.5, maxlat)
txres.txJust = "BottomCenter"
slope_bot = (lat1_ndc-lat2_ndc)/(lon1_ndc-lon2_ndc)
txres.txAngleF = RAD_TO_DEG * np.arctan(slope_bot)
#-- attach to map
dum_bot.append(Ngl.add_text(wks, map, str(lon_labels[n]), \
lon_values[n], lat_val, txres))
return
#-----------------------------------------------------------------------
#-- Function: main
#-----------------------------------------------------------------------
def main():
wks = Ngl.open_wks("png","plot_mptick_10") #-- open workstation
#-----------------------------------
#-- first plot: Lambert Conformal
#-----------------------------------
#-- northern hemisphere
minlon = -90. #-- min lon to mask
maxlon = 40. #-- max lon to mask
minlat = 20. #-- min lat to mask
maxlat = 80. #-- max lat to mask
mpres = Ngl.Resources() #-- resource object
mpres.nglMaximize = True
mpres.nglDraw = False #-- turn off plot draw and frame advance. We will
mpres.nglFrame = False #-- do it later after adding subtitles.
mpres.mpFillOn = True #-- turn map fill on
mpres.mpOutlineOn = False #-- outline map
mpres.mpOceanFillColor = "Transparent" #-- set ocean fill color to transparent
mpres.mpLandFillColor = "Gray90" #-- set land fill color to gray
mpres.mpInlandWaterFillColor = "Gray90" #-- set inland water fill color to gray
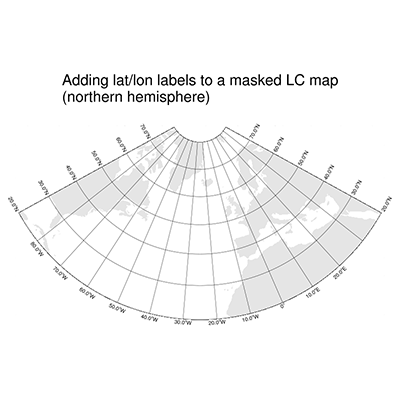
mpres.tiMainString = "Adding lat/lon labels to a masked LC map~C~(northern hemisphere)"
mpres.tiMainOffsetYF = 0.05
mpres.tiMainFontHeightF = 0.016 #-- decrease font size
mpres.mpProjection = "LambertConformal"
mpres.nglMaskLambertConformal = True #-- turn on lc masking
mpres.mpLambertParallel1F = 10
mpres.mpLambertParallel2F = 70
mpres.mpLambertMeridianF = -100
mpres.mpLimitMode = "LatLon"
mpres.mpMinLonF = minlon
mpres.mpMaxLonF = maxlon
mpres.mpMinLatF = minlat
mpres.mpMaxLatF = maxlat
mpres.mpGridAndLimbOn = True
mpres.mpGridSpacingF = 10.
mpres.pmTickMarkDisplayMode = "Always"
#-- create and draw the basic map
map = Ngl.map(wks,mpres)
#-- add labels to the plot
tx = add_labels_lcm(wks,map,10,10)
#-- draw the plot and advance the frame
Ngl.maximize_plot(wks,map)
Ngl.draw(map)
Ngl.frame(wks)
#-----------------------------------
#-- second plot: Mercator projection
#-----------------------------------
#-- southern hemisphere
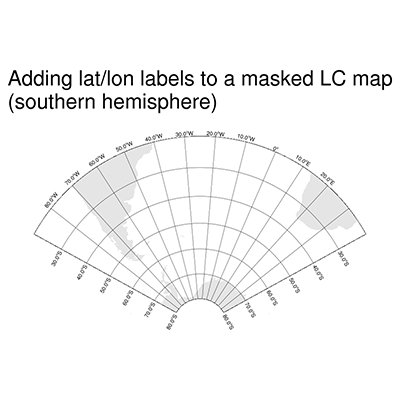
minlat = -80. #-- min lat to mask
maxlat = -20. #-- max lat to mask
mpres.mpMinLatF = minlat
mpres.mpMaxLatF = maxlat
mpres.tiMainString = "Adding lat/lon labels to a masked LC map~C~(southern hemisphere)"
#-- create and draw the basic map
map = Ngl.map(wks,mpres)
#-- add labels to the plot
tx = add_labels_lcm(wks,map,10,10)
#-- maximize the plot, draw it and advance the frame
Ngl.maximize_plot(wks,map)
Ngl.draw(map)
Ngl.frame(wks)
Ngl.end()
if __name__ == '__main__':
main()
Result: