DKRZ PyNGL map tickmark example using HighRes database#
Example script:
#
# File:
# mptick_3.py
#
# Synopsis:
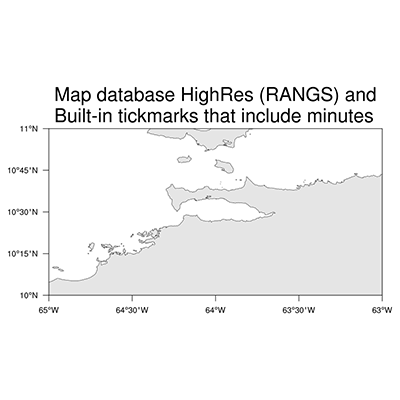
# Demonstrates what happens to the built-in tickmarks
# when you zoom in to less than one degree.
#
# Categories:
# map plot
# HighRes
#
# Based on NCL example:
# mptick_3.ncl
#
# Author:
# Karin Meier-Fleischer
#
# Date of initial publication:
# November 2018
#
# Description:
# This example shows how to create a map.
#
# Effects illustrated:
# o Zooming in on a particular area on a cylindrical equidistant map
# o Drawing a default cylindrical equidistant map
# o Drawing a map using the high resolution map outlines
#
# Output:
# A single visualization is produced.
#
'''
PyNGL Example: mptick_3.py
- Zooming in on a particular area on a cylindrical equidistant map
- Drawing a default cylindrical equidistant map
- Drawing a map using the high resolution map outlines
'''
from __future__ import print_function
import Ngl
#-----------------------------------------------------------------------
#-- Function: main
#-----------------------------------------------------------------------
def main():
wks = Ngl.open_wks("png","plot_mptick_3") #-- open workstation
mpres = Ngl.Resources() #-- resource object
mpres.mpFillOn = True #-- turn map fill on
mpres.mpOutlineOn = True #-- outline map
mpres.mpOceanFillColor = "Transparent" #-- set ocean fill color to transparent
mpres.mpLandFillColor = "Gray90" #-- set land fill color to gray
mpres.mpInlandWaterFillColor = "Gray90" #-- set inland water fill color to gray
mpres.mpProjection = "CylindricalEquidistant" #-- map projection
mpres.mpGridAndLimbOn = False #-- turn off grid lines
mpres.pmTickMarkDisplayMode = "Always" #-- turn on built-in tickmarks
mpres.mpLimitMode = "LatLon"
mpres.mpMinLonF = -65. #-- set min lon
mpres.mpMaxLonF = -63. #-- set max lon
mpres.mpMinLatF = 10. #-- set min lat
mpres.mpMaxLatF = 11. #-- set max lat
mpres.mpDataBaseVersion = "HighRes" #-- turn on highres coastline
mpres.tiMainString = "Map database HighRes (RANGS) and~C~Built-in tickmarks that include minutes"
map = Ngl.map(wks,mpres) #-- create the plot
Ngl.end()
if __name__ == '__main__':
main()
Result: