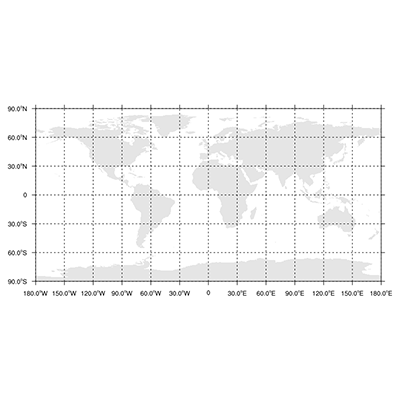
DKRZ PyNGL map tickmark example with gridlines#
Example script:
#
#  File:
#    mptick_5.py
#
#  Synopsis:
#    Demonstrates how to change the tickmark label font height, adjust
#    the tickmark length, and turn on grid lines (a map resource).
#
#  Categories:
#    map plot
#    grid lines
#    annotation
#
#  Based on NCL example:
#    mptick_5.ncl
#
#  Author:
#    Karin Meier-Fleischer
#
#  Date of initial publication:
#    November 2018
#
#  Description:
#    This example shows how to create a map.
#
#  Effects illustrated:
#    o  Decreasing the size of tickmark labels
#    o  Changing the length of tickmarks
#    o  Turning on map grid lines
#
#  Output:
#    A single visualization is produced.
#
'''
  PyNGL Example:     mptick_5.py

  -  Decreasing the size of tickmark labels
  -  Changing the length of tickmarks
  -  Turning on map grid lines

'''
from __future__ import print_function
import numpy as np
import Ngl

#-----------------------------------------------------------------------
#-- Function: main
#-----------------------------------------------------------------------
def main():

    lat_spacing = 30                                    #-- y-axis label increment
    lon_spacing = 30                                    #-- x-axis label increment

    wks = Ngl.open_wks("png","plot_mptick_5")           #-- open workstation

    mpres                        =  Ngl.Resources()     #-- resource object
    mpres.nglDraw                =  False               #-- Don't draw map
    mpres.nglFrame               =  False               #-- Don't advance frame

    mpres.mpFillOn               =  True                #-- turn map fill on
    mpres.mpOutlineOn            =  False               #-- outline map
    mpres.mpOceanFillColor       = "Transparent"        #-- set ocean fill color to transparent
    mpres.mpLandFillColor        = "Gray90"             #-- set land fill color to gray
    mpres.mpInlandWaterFillColor = "Gray90"             #-- set inland water fill color to gray
    mpres.mpProjection           = "CylindricalEquidistant" #-- map projection
    mpres.mpGridAndLimbOn        =  False               #-- turn off grid lines
    mpres.pmTickMarkDisplayMode  = "Never"              #-- turn on built-in tickmarks

    map = Ngl.map(wks,mpres)                            #-- create the base plot

    #-- create x-axis labels starting with 150 degrees west, every 50th degrees
    lon_values = np.arange(-180.0,211.0,lon_spacing)
    lon_labels = []
    for l in lon_values:
       if l < 0:
          lon_labels.append("{}~S~o~N~W".format(np.fabs(l)))
       elif l > 0:
          lon_labels.append("{}~S~o~N~E".format(l))
       else:
          lon_labels.append("0")

    #-- create y-axis labels starting with 80 degrees south, every 20th degrees
    lat_values = np.arange(-90.0,101.0,lat_spacing)
    lat_labels = []
    for l in lat_values:
       if l < 0:
          lat_labels.append("{}~S~o~N~S".format(np.fabs(l)))
       elif l > 0:
          lat_labels.append("{}~S~o~N~N".format(l))
       else:
          lat_labels.append("0")

    #-- new resources for the blank plot
    bres                         =  Ngl.Resources()
    bres.nglMaximize             =  False
    bres.nglPointTickmarksOutward = True                #-- tick marks outside

    bres.vpXF                    =  Ngl.get_float(map,"vpXF")
    bres.vpYF                    =  Ngl.get_float(map,"vpYF")
    bres.vpWidthF                =  Ngl.get_float(map,"vpWidthF")
    bres.vpHeightF               =  Ngl.get_float(map,"vpHeightF")

    bres.trXMinF                 =  Ngl.get_float(map,"trXMinF")
    bres.trXMaxF                 =  Ngl.get_float(map,"trXMaxF")
    bres.trYMinF                 =  Ngl.get_float(map,"trYMinF")
    bres.trYMaxF                 =  Ngl.get_float(map,"trYMaxF")

    bres.tmXBMode                = "Explicit"           #-- use explicit x-axis values and labels
    bres.tmXBValues              =  lon_values          #-- x-axis values
    bres.tmXBLabels              =  lon_labels          #-- x-axis labels
    bres.tmXBLabelFontHeightF    =  0.013               #-- smaller x-axis labels
    bres.tmXBMajorLengthF        =  0.01                #-- change the tickmark length

    bres.tmYLMode                = "Explicit"           #-- use explicit y-axis values and labels
    bres.tmYLValues              =  lat_values          #-- y-axis values
    bres.tmYLLabels              =  lat_labels          #-- y-axis labels
    bres.tmYLLabelFontHeightF    =  0.013               #-- smaller y-axis labels

    bres.tmXMajorGrid            =  True                #-- x-axis turn on grid lines
    bres.tmXMajorGridLineDashPattern = 2                #-- x-axis grid line dash pattern
    bres.tmYMajorGrid            =  True                #-- y-axis turn on grid lines
    bres.tmYMajorGridLineDashPattern = 2                #-- y-axis grid line dash pattern

    #-- create a blank plot with the axes annotations
    blank  = Ngl.blank_plot(wks,bres)

    #-- attach the blank plot to the map
    sres                         = Ngl.Resources()
    sres.amZone                  = 0                    #-- '0' means centered over base plot
    sres.amResizeNotify          = True                 #-- adjust size of plot to base plot
    Ngl.add_annotation(map,blank,sres)

    #-- maximize the plot, draw the plot, and advance the frame
    Ngl.maximize_plot(wks,map)                          #-- maximize the map plot
    Ngl.draw(map)
    Ngl.frame(wks)

    Ngl.end()

if __name__ == '__main__':
    main()
Result: