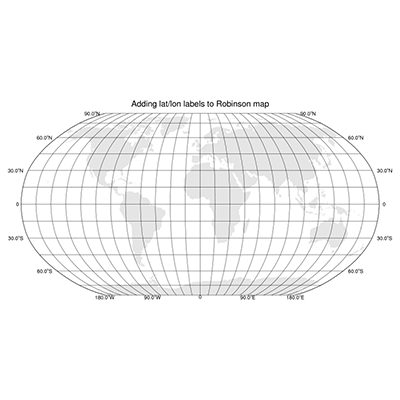
DKRZ PyNGL map tickmarks added to Robinson projection map#
Example script:
#
#  File:
#    mptick_12.py
#
#  Synopsis:
#    Demonstrates adding tickmarks to a Robinson map
#
#  Categories:
#    map plot
#    add text
#
#  Based on NCL example:
#    mptick_12.ncl
#
#  Author:
#    Karin Meier-Fleischer
#
#  Date of initial publication:
#    November 2018
#
#  Description:
#    This example shows how to create a map.
#
#  Effects illustrated:
#    o  Adding longitude/latitude labels to a Robinson map
#    o  Attaching text strings to the outside of a plot
#
#  Output:
#    A single visualization is produced.
#
'''
  PyNGL Example:     mptick_12.py

  -  Adding longitude/latitude labels to a Robinson map
  -  Attaching text strings to the outside of a plot

'''
from __future__ import print_function
import numpy as np
import Ngl

#-------------------------------------------------------
# Function to attach lat/lon labels to a Robinson plot
#-------------------------------------------------------
def add_labels(wks,map,dlat,dlon):

    #-- generate lat/lon values
    dla = (180.0/dlat)+1                  #-- number of lat labels
    dlo = (360.0/dlon)+1                  #-- number of lon lables

    lat_values = np.linspace( -90.0,  90.0, dla, endpoint=True)
    lon_values = np.linspace(-180.0, 180.0, dlo, endpoint=True)
    nlat       = len(lat_values)
    nlon       = len(lon_values)

    #-- assign arrays to hold the labels
    lft, rgt                     = [],[]
    lat_lft_label, lat_rgt_label = [],[]
    lon_bot_label                = []

    #-- text resources
    txres               = Ngl.Resources()
    txres.txFontHeightF = 0.01

    #-- add degree sign and S/N to the latitude labels
    #-- don't write 90S label which would be too close to the lon labels
    for l in lat_values:
        if l == -90.0:
           lat_lft_label.append("".format(l))
           lat_rgt_label.append("".format(l))
        elif l < 0:
           lat_lft_label.append("{}~S~o~N~S    ".format(np.fabs(l)))
           lat_rgt_label.append("    {}~S~o~N~S".format(np.fabs(l)))
        elif l > 0:
           lat_lft_label.append("{}~S~o~N~N    ".format(l))
           lat_rgt_label.append("    {}~S~o~N~N".format(l))
        else:
           lat_lft_label.append("0  ")
           lat_rgt_label.append("   0")

    #-- add degree sign and W/E to the longitude labels
    for l in lon_values:
        if l < 0:
           lon_bot_label.append("{}~S~o~N~W".format(np.fabs(l)))
        elif l > 0:
           lon_bot_label.append("{}~S~o~N~E".format(l))
        else:
           lon_bot_label.append("0")

    #-- add the latitude labels left and right to the plot
    for n in range(0,nlat):
        txres.txJust = "CenterRight"
        lft.append(Ngl.add_text(wks,map,lat_lft_label[n],-180.0,\
                                lat_values[n],txres))
        txres.txJust = "CenterLeft"
        rgt.append(Ngl.add_text(wks,map,lat_rgt_label[n],180.0,\
                                       lat_values[n],txres))
    #-- add the longitude labels at the bottom of the plot
    bot = []
    for n in range(0,nlon):
        txres.txJust = "TopCenter"
        bot.append(Ngl.add_text(wks,map,lon_bot_label[n],lon_values[n],\
                                -90.0,txres))
    return

#-----------------------------------------------------------------------
#-- Function: main
#-----------------------------------------------------------------------
def main():

    wks = Ngl.open_wks("png","plot_mptick_12")              #-- open workstation

    mpres                        =  Ngl.Resources()         #-- resource object
    mpres.mpFillOn               =  True                    #-- turn map fill on
    mpres.mpOutlineOn            =  False                   #-- outline map
    mpres.mpOceanFillColor       = "Transparent"            #-- set ocean fill color to transparent
    mpres.mpLandFillColor        = "Gray90"                 #-- set land fill color to gray
    mpres.mpInlandWaterFillColor = "Gray90"                 #-- set inland water fill color to gray

    mpres.nglDraw                =  False                   #-- turn off plot draw and frame advance. We will
    mpres.nglFrame               =  False                   #-- do it later after adding subtitles.

    mpres.mpProjection           = 'Robinson'               #-- set projection
    mpres.mpPerimOn              =  False                   #-- don't draw the box around the plot
    mpres.mpGridAndLimbOn        =  True                    #-- turn on lat/lon/limb lines
    mpres.pmTickMarkDisplayMode  = 'Never'                  #-- don't draw tickmark border (box) around plot

    mpres.tiMainString           = "Adding lat/lon labels to Robinson map" #-- title
    mpres.tiMainFontHeightF      =  0.010                   #-- title font size

    #-- create and draw the basic map
    map = Ngl.map(wks,mpres)

    #-- add labels to the plot
    tx = add_labels(wks,map,30,90)

    #-- maximize the plot, draw it and advance the frame
    Ngl.maximize_plot(wks,map)
    Ngl.draw(map)
    Ngl.frame(wks)

    Ngl.end()

if __name__ == '__main__':
    main()
Result: