DKRZ PyNGL masking example#
Example script:
#
# File:
# TRANS_masking.py
#
# Synopsis:
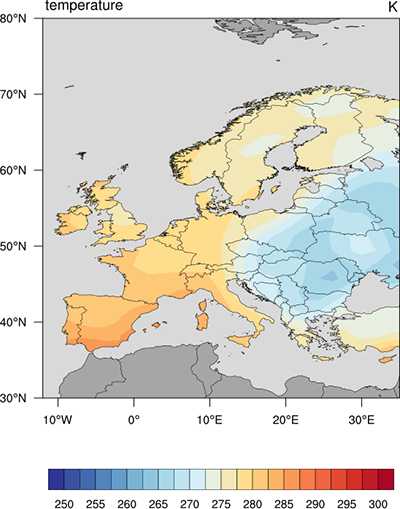
# Illustrates how to mask data
#
# Categories:
# map plot
# contour plot
#
# Author:
# Karin Meier-Fleischer, based on NCL example
#
# Date of initial publication:
# September 2018
#
# Description:
# This example shows how to mask data.
#
# Effects illustrated:
# o Drawing contours on a map
# o Using manual levels
# o Change map resolution
# o Using area specifiers
#
# Output:
# A single visualization is produced.
#
# Notes: The data for this example can be downloaded from
# http://www.ncl.ucar.edu/Document/Manuals/NCL_User_Guide/Data/
#
'''
Transition Guide Python Example: TRANS_masking.py
- Drawing contours on a map
- Using manual levels
- Change map resolution
- Using area specifiers
18-09-11 kmf
'''
from __future__ import print_function
import Ngl, Nio
#-----------------------------------------------------------------------
#-- Function: main
#-----------------------------------------------------------------------
def main():
#-- countries where contours should appear
#-- too small countries: "Monaco","San Marino","Vatican City"
mask_specs = ["Albania","Andorra","Armenia", \
"Austria","Azerbaijan","Belarus","Belgium", \
"Bosnia and Herzegovina","Bulgaria","Croatia", \
"Cyprus","Czech Republic","Denmark","Estonia", \
"Finland","France","Georgia","Germany","Greece", \
"Hungary","Iceland","Ireland","Italy","Kazakhstan", \
"Latvia","Liechtenstein","Lithuania","Luxembourg", \
"Macedonia","Malta","Moldova","Montenegro", \
"Netherlands","Norway","Poland","Portugal","Romania", \
"Russia","Serbia","Slovakia","Slovenia", \
"Spain","Sweden","Switzerland","Turkey","Ukraine", \
"United Kingdom"]
#-- open file and read variables
f = Nio.open_file("rectilinear_grid_3D.nc", "r")
var = f.variables["t"][0,0,:,:]
lat = f.variables["lat"][:]
lon = f.variables["lon"][:]
#-- start the graphics
wks = Ngl.open_wks("png","plot_TRANS_masking_py")
minlat = 30.0
maxlat = 80.0
minlon = -12.0
maxlon = 35.0
#-- resource settings
res = Ngl.Resources()
res.nglFrame = False
res.cnFillOn = True #-- turn on contour level fill
res.cnFillPalette = "cmp_b2r" #-- choose color map
res.cnLinesOn = False #-- don't draw contour lines
res.cnLineLabelsOn = False #-- turn off contour line labels
res.cnLevelSelectionMode = "ManualLevels" #-- use manual contour line levels
res.cnMinLevelValF = 250.0 #-- contour min. value
res.cnMaxLevelValF = 300.0 #-- contour max. value
res.cnLevelSpacingF = 2.5 #-- contour interval
res.cnFillDrawOrder = "Predraw" #-- contours first; then fills
res.lbBoxMinorExtentF = 0.2 #-- height of labelbar boxes
res.lbOrientation = "horizontal" #-- horizontal labelbar
res.lbLabelFontHeightF = 0.014
res.mpDataBaseVersion = "MediumRes" #-- alias to Ncarg4_1
res.mpDataSetName = "Earth..4"
res.mpLimitMode = "LatLon"
res.mpMinLatF = minlat
res.mpMaxLatF = maxlat
res.mpMinLonF = minlon
res.mpMaxLonF = maxlon
res.mpGridAndLimbOn = False
res.mpFillOn = True #-- turn on map fill
res.mpOutlineBoundarySets = "National"
res.mpFillBoundarySets = "NoBoundaries"
res.mpAreaMaskingOn = True
res.mpMaskAreaSpecifiers = mask_specs
res.mpFillAreaSpecifiers = ["land","water"]
res.mpSpecifiedFillColors = ["gray65","gray85","gray65"] #-- Land,Ocean,InlandWater
res.sfXArray = lon
res.sfYArray = lat
#-- viewport resources
res.nglMaximize = False #-- don't maximize plot
res.vpYF = 0.9 #-- start y-position of viewport
res.vpWidthF = 0.65 #-- width of viewport
res.vpHeightF = 0.65 #-- height of viewport
#-- create the contour plot
plot = Ngl.contour_map(wks,var,res)
#-- write variable long_name and units to the plot
txres = Ngl.Resources()
txres.txFontHeightF = 0.018
Ngl.text_ndc(wks,f.variables["t"].attributes['long_name'],0.29,0.92,txres)
Ngl.text_ndc(wks,f.variables["t"].attributes['units'], 0.82,0.92,txres)
Ngl.frame(wks)
#-- call main function
if __name__ == '__main__':
main()