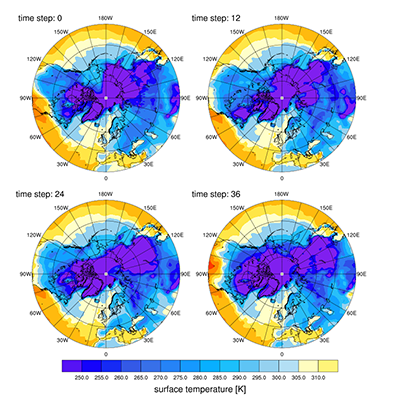
DKRZ PyNGL panel with vp resources example#
Example script:
#----------------------------------------------------------------------
# DKRZ PyNGL Script: panel_vp.py
#
# Description:    Creates a panel plot using the vp-resources instead
#                 of the PyNGL function Ngl.panel.
#
# Output:         plot_panel_vp.png
#
# 28.10.19  meier-fleischer(at)dkrz.de
#----------------------------------------------------------------------
import sys
import os
import numpy as np
import xarray as xr
import Ngl

#----------------------------------------------------------------------
# Based on add_lon_labels from PyNGL example spaghetti.py.
# -- The labels won't fit perfectly when mpCenterLonF is used.
# This procedure adds longitude labels to the outside of a circular
# polar stereographic map.
#----------------------------------------------------------------------
def add_lon_labels(wks,map,res):
    '''
    Function  add_lon_labels(wks, map, res)

       This procedure adds longitude labels to the outside of a circular
       polar stereographic map.

       List the longitude values where you want labels.  It's assumed that
       longitude=0 is at the bottom of the plot, and 180W at the top. You can
       adjust as necessary.
    '''
    lon_values = np.arange(-180,180,30)
    nlon       = lon_values.shape[0]
    lat_values = np.zeros(nlon,'f') + res.mpMinLatF

    #-- Get the NDC coordinates of these lat,lon labels. We'll use this information
    #-- to place labels *outside* of the map plot.
    xndc, yndc = Ngl.datatondc(map,lon_values,lat_values)

    #-- Set an array of justification strings to use with the 'txJust' resource
    #-- for each label, based on which quadrant it appears in.
    just_strs  = ['BottomCenter',                 #-- top of plot
                  'BottomRight','BottomRight',    #-- upper left quadrant
                  'CenterRight',                  #-- left of plot
                  'TopRight','TopRight',          #-- lower left quadrant
                  'TopCenter',                    #-- bottom of plot
                  'TopLeft','TopLeft',            #-- lower right quadrant
                  'CenterLeft',                   #-- right of plot
                  'BottomLeft','BottomLeft']      #-- upper right qudrant

    #-- Create an array of longitude labels with 'W' and 'E' added.
    lon_labels = []
    for i in range(nlon):
        if lon_values[i] == -180:
           lon_labels.append('{:g}W ~C~ '.format(abs(lon_values[i]))) #-- move the label upward
        elif lon_values[i] < 0:
           lon_labels.append('{:g}W '.format(abs(lon_values[i])))     #-- add W and move to the left
        elif lon_values[i] > 0:
           lon_labels.append(' {:g}E'.format(lon_values[i]))          #-- add E and move to the right
        else:
           lon_labels.append(' ~C~{:g}'.format(lon_values[i]))        #-- move label downward

    #-- Loop through each label and add it.
    txres = Ngl.Resources()
    txres.txFontHeightF = 0.01
    for i in range(nlon):
        txres.txJust = just_strs[i]
        Ngl.text_ndc(wks,lon_labels[i],xndc[i],yndc[i],txres)

    return

#-- main function
def main():

    fname = 'rectilinear_grid_2D.nc'          #-- file name
    ds    = xr.open_dataset(fname)            #-- open file

    #-- define the contour minimum, maximum, and increment
    minval = 250.                             #-- minimum contour level
    maxval = 315.                             #-- maximum contour level
    inc    =   5.                             #-- contour level spacing
    ncn    = (maxval-minval)/inc + 1          #-- number of contour levels.

    #-- define contour levels, labels, and colors
    levels = np.arange(minval,maxval,inc)
    labels = [str(s) for s in levels]
    colors = np.arange(10,250,10)

    #-- generate a res object for workstation and open it
    wkres = Ngl.Resources()
    wkres.wkColorMap = "ncl_default"
    wks = Ngl.open_wks('png','plot_panel_vp',wkres)

    #-- set resources
    res =  Ngl.Resources()                     #-- plot mods desired
    res.nglDraw               =  False         #-- don't draw until the end
    res.nglFrame              =  False         #-- don't automatically advance frame
    res.nglMaximize           =  False         #-- don't maximize the plot, we want to
                                                 #--     use viewport settings
    res.vpXF                  =  0.05          #-- viewport x-position
    res.vpYF                  =  0.94          #-- viewport y-position
    res.vpWidthF              =  0.37          #-- viewport width
    res.vpHeightF             =  0.37          #-- viewport height

    res.mpProjection          = 'Stereographic'#-- set map projection
    res.mpEllipticalBoundary  =  True          #-- map projection area is limited to an ellipse
                                                 #--     inscribed within the normal rectangular
                                                 #--     perimeter of the viewport
    res.mpDataSetName         = 'Earth..4'     #-- change map data set
    res.mpDataBaseVersion     = 'MediumRes'    #-- choose higher map resolution
    res.mpLimitMode           = 'LatLon'
    res.mpMaxLatF             =  90.           #-- maximum latitude; northern hemisphere
    res.mpMinLatF             =  30.           #-- minimum latitude
    res.mpCenterLatF          =  90.           #-- center latitude

    res.pmTickMarkDisplayMode = 'Never'        #-- turn off default ticmkark object,
                                               #--      don't draw the box

    res.cnFillOn              =  True          #-- turn contour fill on
    res.cnLinesOn             =  False         #-- turn off contour lines
    res.cnLineLabelsOn        =  False         #-- turn off contour line labels
    res.cnInfoLabelOn         =  False         #-- turn off contour line info label
    res.cnLevelSelectionMode  = 'ManualLevels' #-- set manual levels
    res.cnMinLevelValF        =  minval        #-- minimum value
    res.cnMaxLevelValF        =  maxval        #-- maximum value
    res.cnLevelSpacingF       =  inc           #-- increment

    res.lbLabelBarOn          =  False

    #-- assign plot array
    plot = []

    #-- create the 4 plots
    j = 0
    for i in range(4):
        var = ds.tsurf[j,:,:]                    #-- j. time step
        var,lon = Ngl.add_cyclic(var,ds.lon)     #-- add cyclic point to data array and longitude

        res.sfXArray       =  lon                #-- use cyclic longitude; already numpy array
        res.sfYArray       =  ds.lat.values      #-- use latitude in numpy array
        res.tiMainString   = 'time step: '+str(j)
        res.tiMainOffsetXF =  0.02
        res.tiMainOffsetYF =  -0.01
        res.tiMainPosition = 'Left'

        #-- define position of the plots in the frame
        if(i == 0 or i == 2):
           res.vpXF = 0.08
        else:
           res.vpXF = 0.52
        if(i == 0 or i == 1):
           res.vpYF = 0.94
        else:
           res.vpYF = 0.5

        plot.append(Ngl.contour_map(wks,var,res))#-- create contour plot
        Ngl.draw(plot[i])
        add_lon_labels(wks,plot[i],res)          #-- add labels to map
        j = j + 12      #-- increase time index

    #-- add a common labelbar at the bottom
    lbres = Ngl.Resources()
    lbres.vpWidthF           = 0.7
    lbres.vpHeightF          = 0.10

    lbres.lbOrientation      = 'Horizontal'
    lbres.lbFillPattern      = 'SolidFill'
    lbres.lbMonoFillPattern  = 21              #-- must be 21 for color solid fill
    lbres.lbMonoFillColor    = False           #-- use multiple colors
    lbres.lbFillColors       = colors          #-- indices from loaded colormap
    lbres.lbLabelFontHeightF = 0.010
    lbres.lbLabelAlignment   = 'InteriorEdges'
    lbres.lbLabelStrings     = labels
    lbres.lbTitleOn          = True
    lbres.lbTitleString      = ds.tsurf.long_name + ' [' + ds.tsurf.units + ']'
    lbres.lbTitlePosition    = 'Bottom'
    lbres.lbTitleFontHeightF = 0.016

    lbx, lby  = 0.15, 0.11
    lb = Ngl.labelbar_ndc(wks, len(levels)+1, labels, lbx, lby, lbres)

    #-- close the frame, write the graphic output to disk
    Ngl.frame(wks)

#-- call  main function
if __name__ == '__main__':
    main()
Result: