DKRZ PyNGL station locations (scatter)#
Example script:
#
# File:
# scatter_3.py
#
# Synopsis:
# Shows how to create a scatter plot over a map.
#
# Category:
# map plots
# polymarkers
#
# Based on NCL example:
# scatter_3.ncl
#
# Author:
# Karin Meier-Fleischer
#
# Date of initial publication:
# November, 2018
#
# Description:
# This example shows how to create a scatter plot over a map.
#
# Effects illustrated:
# o Drawing a scatter plot over a map
# o Drawing markers on a map
# o Attaching markers to a map
# o Changing the marker color and size in a map plot
# o Drawing markers on a map indicating the locations of station data
#
# Output:
# A single visualization is produced.
#
'''
PyNGL Example: scatter_3.py
- Drawing a scatter plot over a map
- Drawing markers on a map
- Attaching markers to a map
- Changing the marker color and size in a map plot
- Drawing markers on a map indicating the locations of station data
'''
from __future__ import print_function
import numpy as np
import Ngl,Nio
#-----------------------------------------------------------------------
#-- Function: main
#-----------------------------------------------------------------------
def main():
#-- open file
fname = "95031800_sao.cdf"
diri = Ngl.pynglpath("data") + "/cdf/"
#-- open file and read variables
a = Nio.open_file(diri + fname,"r") #-- open data file
lon = a.variables["lon"][:] #-- get whole "lon" variable
lat = a.variables["lat"][:] #-- get whole "lat" variable
#-- open graphics output
wks = Ngl.open_wks("png","plot_scatter_3")
res = Ngl.Resources()
res.nglFrame = False #-- don't advance the frame
res.nglMaximize = True #-- maximize plot
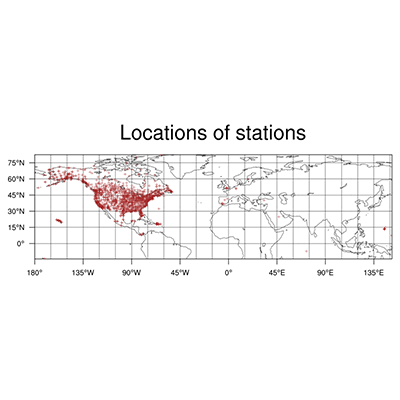
res.tiMainString = "Locations of stations" #-- add title
res.mpLimitMode = "LatLon"
res.mpMinLatF = lat.min()
res.mpMaxLatF = lat.max()
res.mpMinLonF = lon.min()
res.mpMaxLonF = lon.max()
#-- first plot
map = Ngl.map(wks,res) #-- create the map plot, don't draw
mkres = Ngl.Resources()
mkres.gsMarkerIndex = 2
mkres.gsMarkerColor = "Brown"
Ngl.polymarker(wks,map,lon,lat,mkres)
Ngl.frame(wks)
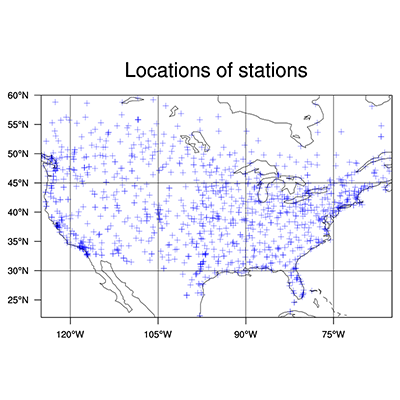
#-- second plot
res.mpMinLatF = 22.
res.mpMaxLatF = 60.
res.mpMinLonF = -125.
res.mpMaxLonF = -65.
map = Ngl.map(wks,res) #-- create the map plot, don't draw
#-- Now attach the markers to the plot and notice that you don't
#-- see them until you draw the plot.
#-- If you resize the plot, the markers will be resized accordingly.
mkres.gsMarkerColor = "Blue"
mkres.gsMarkerSizeF = 15. #-- increase marker sizes
dum = Ngl.add_polymarker(wks,map,lon,lat,mkres)
#-- draw map and advance the frame
Ngl.draw(map)
Ngl.frame(wks)
Ngl.end()
#-- call main function
if __name__ == '__main__':
main()
Result: