DKRZ PyNGL timeseries plot using xarray#
Example script:
#!/usr/bin/env python
#
# File:
# xy_plot_timeseries_date_labels_tickmarks_module.py
#
# Synopsis:
# Illustrates how to use xarray to read the data.
#
# Categories:
# PyNGL
# xy-plot
# xarray
# date string
#
# Author:
# Karin Meier-Fleischer
#
# Date of initial publication:
# August 2019
#
# Description:
# This example shows how to read the data using xarray, compute the average
# and retrieve the date string of type YYYY-MM-DD.
#
# Effects illustrated:
# o Read the data using xarray
# o compute the average of the variable tsurf
# o retrieve the date strings
# o Use explicit x-axis labels
#
# Output:
# A single visualization is produced.
#
'''
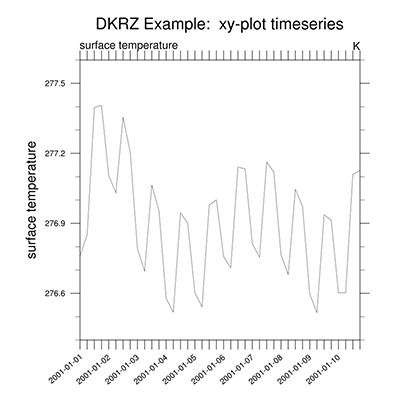
DKRZ PyNGL example: xy_plot_timeseries_date_labels_tickmarks_module.py
- Read the data using xarray
- compute the average of the variable tsurf
- retrieve the date strings
- Use explicit x-axis labels
19-08-27 kmf
'''
from __future__ import print_function
import sys, os
import numpy as np
import xarray as xr
import datetime
import Ngl
#-----------------------------------------------------------------------
#-- Function: add_titles(wks, plot, title, left, center, right, xtitle, ytitle)
#-----------------------------------------------------------------------
def ngl_Strings(wks, plot, title='', left='', center='', right='', xtitle='', ytitle=''):
vpx = Ngl.get_float(plot,"vpXF") #-- retrieve value of res.vpXF from plot
vpy = Ngl.get_float(plot,"vpYF") #-- retrieve value of res.vpYF from plot
vpw = Ngl.get_float(plot,"vpWidthF") #-- retrieve value of res.vpWidthF from plot
vph = Ngl.get_float(plot,"vpHeightF") #-- retrieve value of res.vpHeightF from plot
ymax = vpy+0.08 #-- we need space for the title and strings
if(ymax > 0.98):
print("--> if you can't see the title use res.nglMaximize = False and/or set res.vpYF")
#-- add title
if(title != ""):
tires = Ngl.Resources()
tires.txFontHeightF = 0.016
tires.txJust = "CenterCenter"
tires.txFont = 22 #-- Font 22: Helvetica bold
if(left != "" or center != "" or right != ""):
y = vpy + 0.075
else:
y = vpy + 0.05
Ngl.text_ndc(wks, title, 0.5, y, tires)
#-- add left, center and/or right string
txres = Ngl.Resources()
txres.txFontHeightF = 0.020 #-- font size for left, center and right string
y = vpy + 0.035 #-- y-position
if(left != ""):
txres.txJust = "CenterLeft" #-- text justification
x = vpx #-- x-position
Ngl.text_ndc(wks, left, x, y, txres) #-- add text to wks
if(center != ""):
txres.txJust = "CenterCenter" #-- text justification
Ngl.text_ndc(wks, center, 0.5, y, txres) #-- add text to wks
if(right != ""):
txres.txJust = "CenterRight" #-- text justification
x = vpx+vpw #-- x-position
Ngl.text_ndc(wks, right, x, y, txres) #-- add text to wks
#-- add y-axis title string
txtires = Ngl.Resources()
txtires.txFontHeightF = 0.024 #-- font size for x-axis title string
txtires.txAngleF = 90.0
txtires.txJust = "CenterCenter" #-- text justification
y = vpy - vph/2 #-- y-position
x = vpx - 0.12
Ngl.text_ndc(wks, ytitle, x, y, txtires) #-- add text to wks
#-----------------------------------------------------------------------
#-- Function: conv_time_netcdf(ds)
#-----------------------------------------------------------------------
def conv_time_netcdf(ds):
ntime = len(ds.time)
years = ds.time.dt.year.values
months = ds.time.dt.month.values
days = ds.time.dt.day.values
date_labels = [datetime.date(years[i],months[i],days[i]) for i in range(0,ntime)]
date_labels = np.array(date_labels,dtype='str')
return(date_labels)
#-----------------------------------------------------------------------
#-- Function: main
#-----------------------------------------------------------------------
def main():
print('')
#-- open file and read variable and time
home = os.environ.get('HOME')
fname = os.path.join(home,'data/rectilinear_grid_2D.nc')
ds = xr.open_dataset(fname)
var = ds.tsurf
time = ds.time
#-- xarray deletes the units and long_name attributes, so we have to get
#-- them on another way
print('--> time attributes:', ds.time.attrs)
print('')
units = var.attrs['units']
lname = var.attrs['long_name']
#-- print some information about the variable and the time coordinate
print('--> var: ',var)
print('')
#-- convert the time values to date strings using a user defined function
date_labels = conv_time_netcdf(ds)
print('--> date_labels ',type(date_labels))
print('')
#-- for explicit x-axis generate simple time array
time = np.arange(0,len(ds.time),1)
#-- compute the area mean without weighting
areamean = np.average(var,axis=(1,2))
print('--> areamean: ',areamean)
print('')
#-- open a workstation
wks = Ngl.open_wks('png','plot_xy_plot_timeseries') #-- graphics output
#-- set resources/attributes
res = Ngl.Resources() #-- generate an res object for plot
res.tiMainString = 'DKRZ Example: xy-plot timeseries' #-- draw a title
res.tiMainOffsetYF = 0.02
res.nglMaximize = False
res.nglPointTickmarksOutward = True #-- point tickmarks outward
res.nglDraw = False
res.nglFrame = False
res.vpWidthF = 0.7
res.vpHeightF = 0.7
res.vpXF = 0.2
res.vpYF = 0.85
res.tmXBMode = 'Explicit' #-- use explicit values
res.tmXBValues = time
res.tmXBLabels = list(date_labels)
res.tmXBLabelFontHeightF = 0.006
res.tmXBLabelJust = 'CenterRight'
res.tmXBLabelDeltaF = 0.2
res.tmXBLabelAngleF = 40.0
res.tmXBLabelStride = 4
#-- draw the plot
plot = Ngl.xy(wks,time,areamean,res)
#-- add additional strings to plot (like NCL's gsnLeftString and gsnRightString)
ngl_Strings(wks, plot, left=lname, right=units, ytitle=lname)
#-- done
Ngl.draw(plot)
Ngl.frame(wks)
Ngl.end()
if __name__ == "__main__":
main()
Result: