Python matplotlib/cartopy data on curvilinear rotated pole grid#
Software requirements:
Python 3
matplotlib
cartopy
numpy
xarray
Example script#
data_on_curvilinear_rotated_pole_grid.py
#!/usr/bin/env python
# coding: utf-8
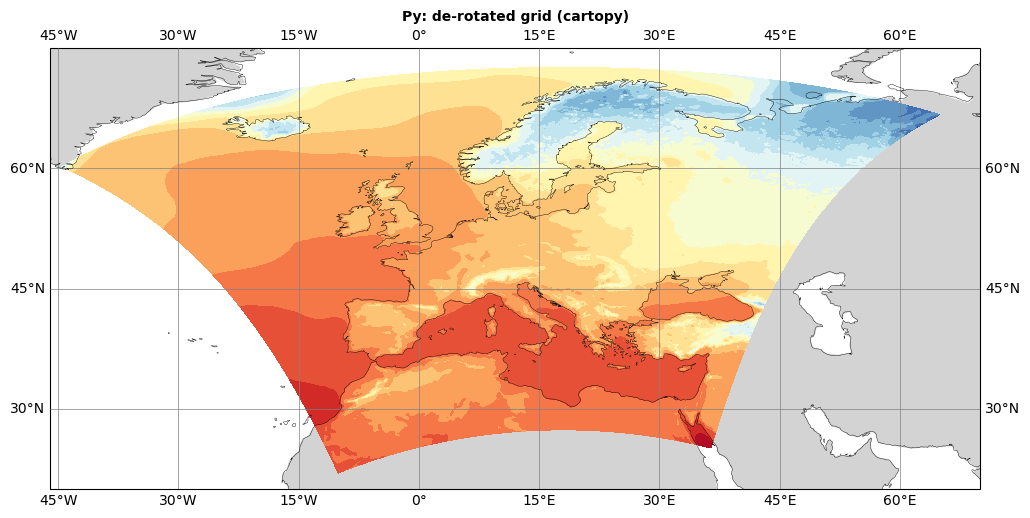
'''
DKRZ example
Plot CORDEX EUR-11 data with curvilinear rotated pole grid on a map without remapping.
Content
- draw and zoom into a map
- draw coastlines, state borders and provinces, and grid lines
- draw filled contours
- save to PNG
-------------------------------------------------------------------------------
2022 copyright DKRZ licensed under CC BY-NC-SA 4.0 <br>
(https://creativecommons.org/licenses/by-nc-sa/4.0/deed.en)
-------------------------------------------------------------------------------
'''
import sys
import xarray as xr
import numpy as np
import matplotlib.pyplot as plt
import cartopy
import cartopy.crs as ccrs
def read_data(file_name, variable_name):
'''Read netCDF file
Parameters:
file_name name of the data file
variable_name name of the variable
Returns:
lat, lon, var, pole_longitude, pole_latitude
'''
ds = xr.open_dataset(file_name)
var = ds[variable_name].isel(time=0)
rlat = ds.rlat
rlon = ds.rlon
pole = ds.rotated_pole
try:
if hasattr(pole,'grid_north_pole_longitude'):
px = pole.attrs['grid_north_pole_longitude']
if hasattr(pole,'grid_north_pole_latitude'):
py = pole.attrs['grid_north_pole_latitude']
except:
print('Unexpected error:', sys.exc_info()[0])
raise
return rlon, rlat, var, px, py
def main():
#-- file and variable name
filename = '../../data/CORDEX_EUR-11.nc'
varname = 'tas'
#-- read file content and return relevant variables
rlon, rlat, var, pole_lon, pole_lat = read_data(filename, varname)
colormap = "RdYlBu_r"
#-- create the figure
plt.switch_backend('agg')
fig, ax = plt.subplots(subplot_kw=dict(projection=ccrs.PlateCarree()))
ax.set_title('Py: de-rotated grid (cartopy)', fontsize=10, fontweight='bold')
#-- zoom into the map
ax.set_extent([-46, 70, 20, 75], crs=ccrs.PlateCarree())
#-- add coastlines, state borders and provinces, and grid lines
ax.coastlines(resolution='50m', linewidth=0.3, color='black')
ax.add_feature(cartopy.feature.OCEAN, color='white', zorder=0)
ax.add_feature(cartopy.feature.LAND, color='lightgray',zorder=0,
linewidth=0.5, edgecolor='black')
ax.gridlines(draw_labels=True, linewidth=0.5, color='gray',
xlocs=range(-180,180,15), ylocs=range(-90,90,15))
#-- use ccrs.RotatedPole as data CRS for parameter transform
crs = ccrs.RotatedPole(pole_longitude=pole_lon, pole_latitude=pole_lat)
ax.contourf(rlon, rlat, var, levels=15, cmap=colormap, transform=crs)
#-- save to PNG
plt.savefig('plot_Python_curvilinear_grid_derotated_1.png', bbox_inches='tight', dpi=200)
if __name__ == '__main__':
main()