Python contour filled plot#
Software requirements:
Python 3
numpy
xarray
matplotlib
cartopy
Example script#
matplotlib_contour_filled.py
#!/usr/bin/env python
# coding: utf-8
'''
DKRZ example
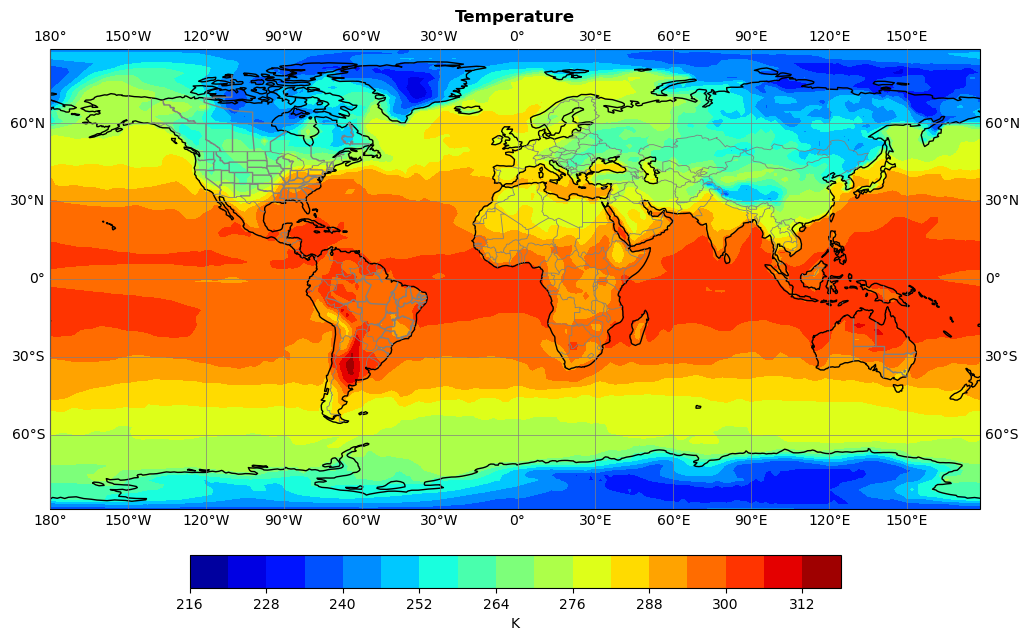
This example demonstrates how to plot filled contours on a map, and add a colorbar.
Content
- draw map
- draw coastlines, state borders and provinces
- draw filled contours
- add colorbar
- save to PNG
-------------------------------------------------------------------------------
2021 copyright DKRZ licensed under CC BY-NC-SA 4.0 <br>
(https://creativecommons.org/licenses/by-nc-sa/4.0/deed.en)
-------------------------------------------------------------------------------
'''
import numpy as np
import xarray as xr
import matplotlib.pyplot as plt
import cartopy.crs as ccrs
import cartopy.feature as cfeature
def main():
#-- open data set
ds = xr.open_dataset('../../data/rectilinear_grid_2D.nc')
#-- create states outlines
provinces = cfeature.NaturalEarthFeature(category='cultural',
name='admin_1_states_provinces_lines',
scale='50m',
facecolor='none')
plt.switch_backend('agg')
#-- create figure and axes object
fig, ax = plt.subplots(figsize=(12,12), subplot_kw=dict(projection=ccrs.PlateCarree()))
#-- add coastlines, country border lines, and grid lines
ax.coastlines(zorder=1)
ax.add_feature(cfeature.BORDERS, linewidth=0.6, edgecolor='gray', zorder=2)
ax.add_feature(provinces, edgecolor='gray', zorder=3)
ax.gridlines(draw_labels=True,
linewidth=0.5,
color='gray',
xlocs=range(-180,180,30),
ylocs=range(-90,90,30),
zorder=4)
#-- add title
ax.set_title('Temperature', fontsize=12, fontweight='bold')
#-- create contour line plot
cnplot = ax.contourf(ds.lon, ds.lat, ds.tsurf.isel(time=0),
cmap='jet',
levels=15,
zorder=0,
transform=ccrs.PlateCarree())
#-- add colorbar
cbar = plt.colorbar(cnplot, orientation='horizontal', pad=0.05, shrink=0.7)
cbar.set_label('K')
#-- save graphic output to PNG file
plt.savefig('plot_matplotlib_contour_filled_rect.png',
bbox_inches='tight',
dpi=100)
if __name__ == '__main__':
main()
Plot result#