Python: Asymmetrical colorbars#
Description
In Matplotlib it is very easy to use predefined colormaps, even if the data values are to be assigned asymmetrically. It becomes a little more complicated if, for example, you want to use a colormap with white in the middle, but not its first n-colors, i.e. ‘light blue/white/dark red’ instead of ‘dark blue/white/dark red’.
Software requirements
Python 3
numpy
matplotlib
Example script#
about_asymmetrical_colorbars.py
#!/usr/bin/env python
# coding: utf-8
# Asymmetrical colormaps
#
# In Matplotlib it is very easy to use predefined colormaps, even if the data
# values are to be assigned asymmetrically. It becomes a little more complicated
# if, for example, you want to use a colormap with white in the middle, but not
# its first n-colors, i.e. 'light blue/white/dark red' instead of
# 'dark blue/white/dark red'.
#
# This notebook contains some examples that provide solutions to those annoying
# problems of working with asymmetrical colormaps and colorbars.
#
# Content
# 1. Create random data
# 2. Example using vmin/vmax
# 3. Use normalization
# 4. Create colormap from RGBA arrays
# 5. Define colormap midpoint and cut off outlaying colors
#
import numpy as np
import matplotlib.pyplot as plt
import matplotlib as mpl
import matplotlib.colorbar as colorbar
import matplotlib.colors as mcolors
import matplotlib.cm as mcm
# Create random data
#-- set data minimum and maximum
vmin = -10.
vmax = 10.
#-- generate random data
n = 10
x = np.arange(1, n+1, 1)
y = np.arange(1, n+1, 1)
np.random.seed(20250101)
data = np.random.uniform(vmin, vmax, (n,n))
# Example using vmin/vmax
#
# First we start with the common use of the symmetrical colormap `RdBu` to plot
# random data. And draw next to it for comparison the plot generated using the
# vmin and vmax keywords to set the data range displayed.
#
# The left plot uses only the default settings for a symmetrical data range.
#
# The right plot uses the `vmin` and `vmax` keywords to limit the data range
# to -2 to 10.
fig, (ax1,ax2) = plt.subplots(nrows=1, ncols=2, figsize=(8,3), layout='tight')
#-- left plot: use defaults
ax1.set_title('use defaults')
plot_l = ax1.pcolormesh(x, y, data, cmap='RdBu_r')
cb_left = plt.colorbar(plot_l, ax=ax1, shrink=0.9, pad=0.1)
#-- right plot: use vmin, vmax
ax2.set_title('vmin=-2, vmax=10.')
plot_r = ax2.pcolormesh(x, y, data, cmap='RdBu_r', vmin=-2., vmax=10.)
cb_right = plt.colorbar(plot_r, ax=ax2, shrink=0.9, pad=0.1)
plt.show()
# In the right plot the colors of the colorbar are still the same as in the left
# plot, only the colorbar labels and their mapping to the colors have changed -
# value zero is mapped to blue instead to white! This is not really what we want
# here and this is why we have to use another way in the next example to keep
# the white in the middle.
# Use normalization
#
# From https://matplotlib.org/stable/users/explain/colors/colormapnorms.html
# 'Objects that use colormaps by default linearly map the colors in the colormap
# from data values vmin to vmax'.
#
# Normalization: For asymmetrical colormaps you have to use the `TwoSlopeNorm`
# method instead of `Normalize` to be able to set the center of the colormap to
# a given value.
#
# The next example shows how to use `RdBu_r` which is the reversed orderd `RdBu`
# colormap and the `TwoSlopeNorm` normalization method to create an asymmetrical
# colorbar with white at value zero.
#
# The left plot shows the default colorbar that shows a nonlinear colorbar axis
# scaling.
#
# The plot on the right shows that we can change the non-linear representation
# of the colorbar to a linear representation by using the colorbar axis method
# `set_yscale`.
#-- create the plot
fig, (ax1,ax2) = plt.subplots(nrows=1, ncols=2, figsize=(8,3))
#-- for asymmetrical colormaps you have to use the `TwoSlopeNorm` method instead
# of `Normalize`
norm = mcolors.TwoSlopeNorm(vmin=-2., vcenter=0, vmax=vmax)
#-- use TwoSlopeNorm
ax1.set_title('TwoSlopeNorm')
plot_l = ax1.pcolormesh(x, y, data,
cmap='RdBu_r',
norm=norm)
cb_left = plt.colorbar(plot_l, ax=ax1, shrink=0.9, pad=0.1)
#-- and set cbar yscale to linear
ax2.set_title('TwoSlopeNorm, \ncbar yscale=linear')
plot_r = ax2.pcolormesh(x, y, data,
cmap='RdBu_r',
norm=norm)
cb_right = plt.colorbar(plot_r, ax=ax2, shrink=0.9, pad=0.1)
#-- colorbar: use a linear y-axis scale when working with an asymmetrical
#-- normalization
cb_right.ax.set_yscale('linear')
plt.show()
# Create colormap from RGBA arrays
#
# In the next example we define our own colormap from given blue and red RGBA
# arrays from the predefined colormaps `Blues` and `Reds`, stack the arrays,
# and use the `mcolors.LinearSegmentedColormap.from_list` method to generate a
# colormap.
#
# If the new colormap does not exist, we register it by a given name which
# allows us to use the new colormap name instead the object.
#-- RGBA colors
#-- Use some blues, reds and white in the middle.
#-- The whites (2 x) have to be in the middle of the colormap to use the
#-- TwoSlopeNorm method correctly.
whites = [[1.0, 1.0, 1.0, 1.0]] * 2
blues = mcm.Blues_r(np.linspace(0, 1, 127))
reds = mcm.Reds(np.linspace(0, 1, 127))
rgba_cmap = np.vstack((blues, whites, reds))
#-- create the colormap from the stacked RGBA array
cmap_name = 'BluesWhiteRed'
cmap = mcolors.LinearSegmentedColormap.from_list(cmap_name, rgba_cmap, N=len(rgba_cmap))
#-- register the new colormap for the later use by name
try:
mpl.colormaps.register(cmap, name=cmap_name)
except:
print(f'The colormap "{cmap_name}" is already registered')
print(f'New colormap "{cmap_name}" with n-colors: {cmap.N}')
# Create the plot
fig, ax = plt.subplots(figsize=(4,3))
#-- for asymmetrical colormaps you have to use the `TwoSlopeNorm` method instead
#-- of `Normalize`
norm = mcolors.TwoSlopeNorm(vmin=-2., vcenter=0, vmax=vmax)
plot = ax.pcolormesh(x, y, data,
cmap='BluesWhiteRed',
norm=norm)
cbar = plt.colorbar(plot, ax=ax, shrink=0.8, pad=0.07)
#-- colorbar: use a linear y-axis scale when working with an asymmetrical normalization
cbar.ax.set_yscale('linear')
plt.show()
# In the next example we don't want to use the dark blues and therefore we skip that colormap indices.
#-- RGBA colors
#-- Use some blues, reds and white in the middle.
#-- The whites (2 times) have to be in the middle of the colormap to use the
#-- TwoSlopeNorm method correctly.
whites = [[1.0, 1.0, 1.0, 1.0]] * 2
blues = mcm.Blues_r(np.linspace(0, 1, 256))
blues = blues[150:, :]
reds = mcm.Reds(np.linspace(0, 1, 256))
rgba_cmap = np.vstack((blues, whites, reds))
#-- create the colormap from the RGBA array
cmap_name = 'LightBlueWhiteRed'
cmap = mcolors.LinearSegmentedColormap.from_list(cmap_name, rgba_cmap, N=len(rgba_cmap))
#-- register the new colormap for the later use by name
try:
mpl.colormaps.register(cmap, name=cmap_name)
except:
print(f'The colormap "{cmap_name}" is already registered')
print(cmap.N)
fig, ax = plt.subplots(figsize=(4,3))
#-- for asymmetrical colormaps you have to use the `TwoSlopeNorm` method instead
#-- of `Normalize`
norm = mcolors.TwoSlopeNorm(vmin=-2., vcenter=0, vmax=10.)
plot = ax.pcolormesh(x, y, data,
cmap='LightBlueWhiteRed',
norm=norm)
cbar = plt.colorbar(plot, ax=ax, shrink=0.8, pad=0.07)
#-- colorbar: use a linear y-axis scale when working with an asymmetrical
#-- normalization
cbar.ax.set_yscale('linear')
plt.show()
# Unfortunately, you can now see that the result is not what we want. The zero
# point is shifted in the colorbar to light red, but should remain white.
#
# The next example shows a solution approach found in Stack Overflow.
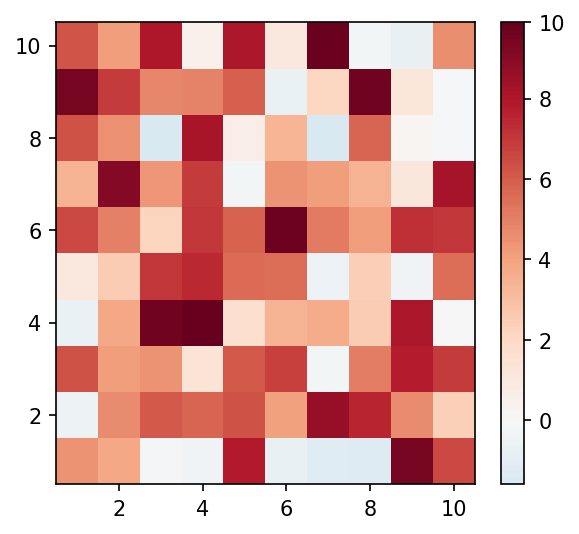
# Define colormap midpoint and cut off outlaying colors
#
# The next example demonstrates the use of a pre-defined colormap with a user
# defined subclass of the `cm.Normalize` class to generate the plot and it's
# colorbar cutting off outlaying colors.
#
# Based on an example from _Stack Overflow_: <br>
# https://stackoverflow.com/questions/55665167/asymmetric-color-bar-with-fair-diverging-color-map <br>
# https://stackoverflow.com/questions/7404116/defining-the-midpoint-of-a-colormap-in-matplotlib <br>
#-- generate random data and define the value range
vmin, vmax = -2., 10.
n = 10
x, y = np.meshgrid(np.arange(1, n+1, 1), np.arange(1, n+1, 1))
np.random.seed(20250101)
z = np.random.uniform(vmin, vmax, (n,n))
#-- subclassing cm.Normalize
class MidpointNormalize(mcolors.Normalize):
def __init__(self, vmin=None, vmax=None, midpoint=None, clip=False):
self.midpoint = midpoint
mcolors.Normalize.__init__(self, vmin, vmax, clip)
def __call__(self, value, clip=None):
v_ext = np.max( [ np.abs(self.vmin), np.abs(self.vmax) ] )
x, y = [-v_ext, self.midpoint, v_ext], [0, 0.5, 1]
return np.ma.masked_array(np.interp(value, x, y))
norm = MidpointNormalize(midpoint=0)
#-- generate the plot
fig, ax = plt.subplots(figsize=(4.5, 4))
plot = ax.pcolormesh(x, y, z, cmap='RdBu_r', norm=norm)
cbar = plt.colorbar(plot)
plt.show()
plt.savefig(f'plot_asymmetrical_colorbars.png', bbox_inches='tight', dpi=150)
Plot result#