Python colorbar with separated boxes#
Software requirements:
Python 3
numpy
xarray
matplotlib
cartopy
Example script#
colorbar_with_separated_boxes.py
#!/usr/bin/env python
# coding: utf-8
# DKRZ example
#
# Draw a color box legend with separated boxes from scratch.
#
# In some cases it is useful to use a colorbar where the color boxes are
# separated by white space. In this case, the color box labels are directly
# below or next to each other, and not in between as is usually the case with
# colorbars.
#
# This Python script demonstrates how to write the function that does it for us.
# Therefore, the function 'draw_color_box_legend' is defined and two examples
# shows us how to use the function to generate
#
# 1. a horizontal and
# 2. a vertical colorbar
#
# for a pcolormesh plot.
#
# 2023 DKRZ, licensed under CC BY-NC-SA 4.0
import os
import inspect
import xarray as xr
import numpy as np
import matplotlib.pyplot as plt
import matplotlib.colors as mcolors
from matplotlib.patches import Rectangle
import cartopy.crs as ccrs
#-- Function draw_color_box_legend
#
# Create a colorbar with separated color boxes.
def draw_color_box_legend(fig, ax, cmap='None', vmin=0., vmax=1., space=0.1, **kwargs):
''' Create a legend with separated color boxes from scratch.
Parameters:
ax : subplot object
axis to add legend
vmin : numeric
data minimum
vmax : numeric
data maximum
space : numeric
data increment between boxes
**kwargs :
xpad : float
move legend horizontal
ypad : float
move legend vertical
orientation : str
orientation of the legend, 'horizontal' (default) or 'vertical'
shrink : float
resize the legend length, value between 0. and 1.
fontsize : int
set the colorbar label font size, default=7
'''
__funcname__ = inspect.currentframe().f_code.co_name # get the function name
#-- use kwargs or set to default
for key, value in kwargs.items():
locals()[f'{key}'] = value
if 'orientation' not in locals(): locals()['orientation'] = 'horizontal'
if 'xpad' not in locals(): locals()['xpad'] = '0.1'
if 'ypad' not in locals(): locals()['ypad'] = '0.0'
if 'shrink' not in locals(): locals()['shrink'] = '0.9'
if 'fontsize' not in locals(): locals()['fontsize'] = 7 # label font size
#-- get colors from cmap
colors = [mcolors.rgb2hex(cmap(i)) for i in range(cmap.N)]
nboxes = int((vmax-vmin)/space)
dx = dy = 1./nboxes
v = [ vmin + (i * space) for i in range(nboxes+1) ]
#-- get the bounds of the given plot object ax
axx, axy, axw, axh = ax.get_position().bounds
lx = axx + locals()['xpad'] # legend left position
ly = axy + locals()['ypad'] # legend bottom position
lwidth = locals()['shrink']
#-- horizontal orientation of the legend
if locals()['orientation'] == 'horizontal':
width = dx / 4 # width of color box
height = dy * 2 # height of color box
# generate x-array for color boxes positions; set y-value
ii = 0.
x = [ ii + (i * dx) for i in range(nboxes+1) ]
y = 0. + locals()['ypad']
# add new axis for colorbar
lheight = dy # legend height
cax = fig.add_axes([lx, ly-0.1, lwidth, lheight], autoscalex_on=True)
#-- x,y,w,h
# create color boxes
for i in range(nboxes+1):
rect = Rectangle(xy=(x[i], y),
width=width,
height=height,
edgecolor='black',
facecolor=colors[i],
linewidth=0.5,
clip_on=False)
plt.gca().add_patch(rect)
# add text below color boxes
dty = -0.15
cax.text(x[i]+width/2, dty+locals()['ypad'], r'$\geq$' + str(v[i]),
fontsize=locals()['fontsize'], weight='bold', ha='center')
#-- vertical orientation of the legend
elif locals()['orientation'] == 'vertical':
width = dx /6 # width of color box
height = dy /4 # height of color box
# generate y-array for color boxes positions; set x-value
ii = axy + locals()['ypad']
y = [ ii + (i * (height+0.05)) for i in range(nboxes+1) ]
x = axx + axw + 0.28
# add new axis for the legend
lheight = axh # legend height
cax = fig.add_axes([lx, ly-0.1, lwidth, lheight], autoscalex_on=True) #-- x,y,w,h
# create color boxes
for i in range(nboxes+1):
rect = Rectangle(xy=(x, y[i]),
width=width,
height=height,
edgecolor='black',
facecolor=colors[i],
linewidth=0.5,
clip_on=False)
plt.gca().add_patch(rect)
# add text below color boxes
dtx = 0.01
cax.text(x+width+dtx, y[i]+height/2, r'$\geq$' + str(v[i]),
fontsize=locals()['fontsize'], weight='bold', va='center', ha='left')
else:
raise Exception(f'NameError: function {__funcname__}() - parameter setting ',
f'orientation = "{locals()["orientation"]}" is invalid, ',
f'valid are "horizontal" (default) or "vertical"')
return
cax.axis('off')
return cax
#-- main
def main():
#-- Read the data
#
# Open the data file and select the variable tsurf of first time step.
ds = xr.open_dataset(os.environ['HOME']+'/data/rectilinear_grid_2D.nc')
var = ds.tsurf.isel(time=0)
# Set min and max
#
# Choose the variable minimum and maximum which are needed for the normalization
# used with the colormap in ax.pcolormesh.
print(f'min: {np.floor(var.min()).data}')
print(f'min: {np.floor(var.max()).data}')
vmin = 250.
vmax = 300.
vinc = 5.
# Get the colormap and compute the norm.
nlevs = np.arange(vmin, vmax+vinc, vinc).size
cmap = plt.get_cmap('RdBu_r', nlevs)
norm = mcolors.TwoSlopeNorm(vmin=vmin, vcenter=275, vmax=vmax)
color_list = [mcolors.rgb2hex(cmap(i)) for i in range(cmap.N)]
print(f'Number of colors: {len(color_list)}')
# Plotting
proj = ccrs.PlateCarree() # map projection
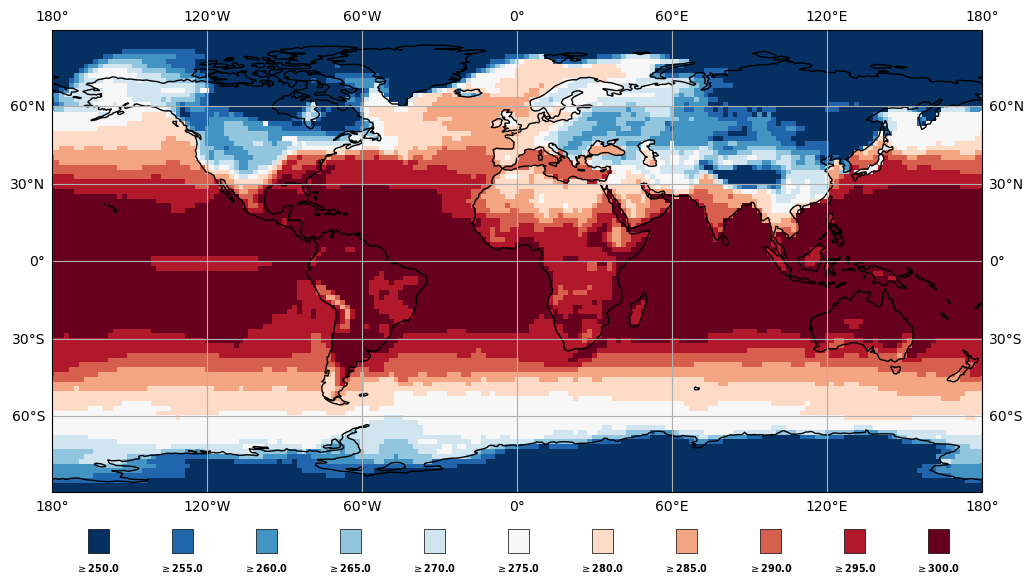
#-- 1. Horizontal color box legend (default)
plt.switch_backend('agg')
fig, ax = plt.subplots(figsize=(12,12), subplot_kw={"projection":proj})
ax.coastlines()
ax.gridlines(draw_labels=True)
plot = ax.pcolormesh(ds.lon, ds.lat, var,
cmap=cmap,
norm=norm,
transform=proj)
cbl = draw_color_box_legend(fig, ax,
cmap=cmap,
vmin=vmin,
vmax=vmax,
space=vinc,
xpad=0.03,
ypad=0.045,
shrink=0.7)
plt.savefig('plot_colorbar_separated_boxes_example_h.png', bbox_inches='tight', facecolor='white')
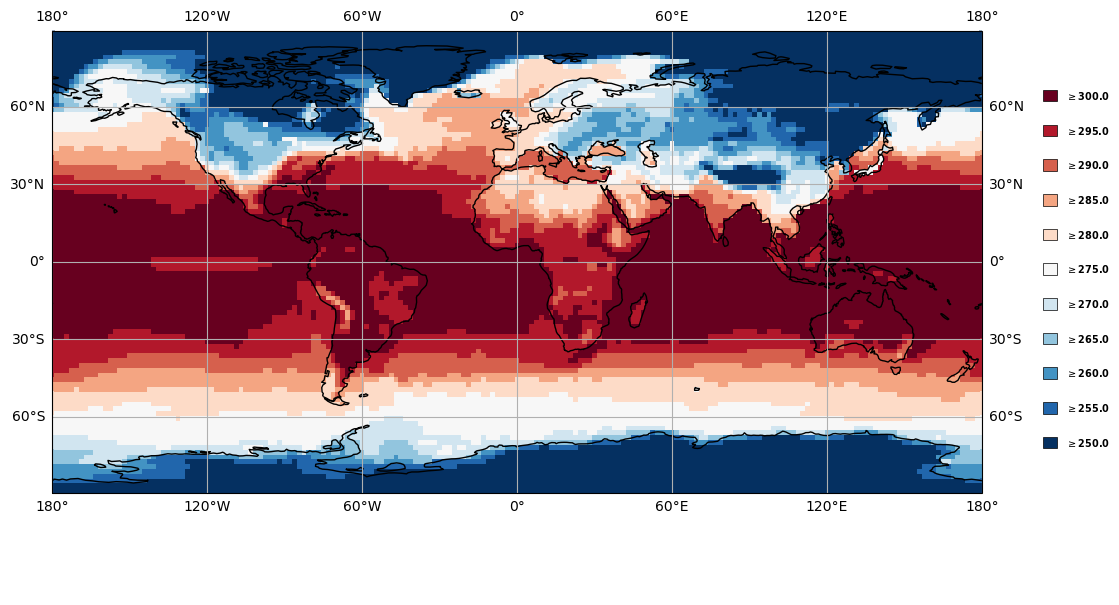
#-- 2. Vertical color box legend
fig, ax = plt.subplots(figsize=(12,12), subplot_kw={"projection":proj})
ax.coastlines()
ax.gridlines(draw_labels=True)
plot = ax.pcolormesh(ds.lon, ds.lat, var,
cmap=cmap,
norm=norm,
transform=proj)
cbl = draw_color_box_legend(fig, ax,
cmap=cmap,
vmin=vmin,
vmax=vmax,
space=vinc,
xpad=0.,
ypad=0.015,
orientation='vertical',
shrink=0.7)
plt.savefig('plot_colorbar_separated_boxes_example_v.png', bbox_inches='tight', facecolor='white')
if __name__ == '__main__':
main()
Plot results#