Python create colormap from named colors#
Software requirements:
Python 3
numpy
matplotlib
Example script#
generate_new_colormap_from_named_colors_rgb.py
#!/usr/bin/env python
'''
DKRZ example
Generate colormaps from given named colors
This script generates a new Matplotlib color object of n-colors from a given
list of named colors. Furthermore we write the RGB tuples of the color object
into a text file with two header lines needed for the use with NCL. And of
course we check the results in each case.
-------------------------------------------------------------------------------
2023 copyright DKRZ licensed under CC BY-NC-SA 4.0
(https://creativecommons.org/licenses/by-nc-sa/4.0/deed.en)
-------------------------------------------------------------------------------
'''
import os
import numpy as np
import matplotlib.colors as mcolors
import matplotlib.pyplot as plt
def main():
#-- Choose named colors
#
# We want to create a colormap that goes from white to red, yellow, light cyan,
# lightblue to dark blue. Therefore we create a list of the appropriate named
# colors.
color_list = ['white', 'red', 'yellow', 'lightcyan', 'lightblue', 'navy']
# Let's have a look at the RGB values of the color_list.
for color in color_list:
print(mcolors.to_rgba(color))
#-- Create colormap from linear mapping segments (color_list)
#
# In the next step we want to generate the a colormap with 100 colors named
# cmap_wryb. The color_list can be converted into an matplotlib.colors object
# with `matplotlib.colors.LinearSegmentedColormap.from_list`.
colormap_name = 'cmap_wryb'
ncolors = 100
color_obj = mcolors.LinearSegmentedColormap.from_list(colormap_name,
color_list,
N=ncolors)
# Within the notebook, we can call the colormap object directly and it will
# automatically display the corresponding colorbar. In a script nothing happens.
color_obj
for i in range(5):
print(color_obj(i)[0:3])
#-- Check colormap
#
# Let's see how the colormap looks in detail now, therefore we create a
# 2-dimensional array of range 0 to ncolors and plot the array with
# Matplotlib's `pcolormesh`.
data = np.arange(0,ncolors).reshape((10,10))
plt.switch_backend('agg')
fig, ax = plt.subplots()
plot = ax.pcolormesh(data, cmap=color_obj)
plt.colorbar(plot)
plt.savefig(colormap_name+'_display.png', bbox_inches='tight', dpi=100)
#-- Save the RGB values of the color object to an NCL colormap file
#
# Now we can write the RGB color tuples of the color object into an RGB text
# file if we want to use them again elsewhere.
colormap_file = 'cmap_wryb.rgb'
# delete colormap file
os.system('rm -f '+colormap_file)
# Write the two NCL header lines to tzhe colormap file and the RGB color
# tuples.
with open(colormap_file, 'w') as f:
# write NCL colormap header lines
f.write(f'ncolors = {ncolors}\n')
f.write('# r g b\n')
# write the RGB color tuples
for j in range(ncolors):
#color_tuple = color_obj(j)
#f.write(' '.join([str(x) for x in color_tuple[0:3]])+'\n')
f.write(' '.join([str(x) for x in color_obj(j)[0:3]])+'\n')
os.system('head -5 cmap_wryb.rgb')
#-- Read an NCL colormap file with Matplotlib
#
# You can read an NCL colormap file with the `numpy.loadtxt` function by skipping
# the first two lines. The colormap can only be used by its name when it was
# registered before. The next steps shows how to do that.
ncl_wryb = np.loadtxt('cmap_wryb.rgb', skiprows=2, delimiter=' ')
# Now, we can convert the RGB array to a Matplotlib color object with
# matplotlib.colors.ListedColormap function.
CMAP = mcolors.ListedColormap(ncl_wryb, name='NCL_WRYB')
CMAP
# To be able to use the colormap by its name, here NCL_WRYB, we have to use
# `matplotlib.pyplot.register_cmap` to register the color object with this name.
#
# Use the try/except method to get rid of the warning when you re-run the cell
# again.
try:
plt.register_cmap('NCL_WRYB', CMAP)
except ValueError:
pass
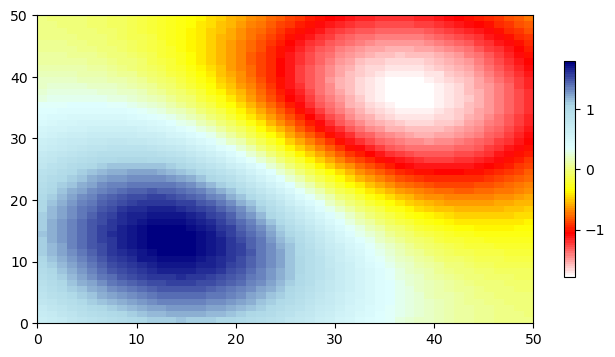
# Check if the colormap is correct and registered.
xi = np.arange(-0.75, 1.75, 0.05)
yi = np.arange(-0.75, 1.75, 0.05)
xmg, ymg = np.meshgrid(xi, yi)
x1 = np.exp(-xmg**2 - ymg**2)
x2 = np.exp(-(xmg-1)**2 - (ymg-1)**2)
data = (x1-x2)*2
fig, ax = plt.subplots(figsize=(8,4))
plot = ax.pcolormesh(data, cmap='NCL_WRYB')
cbar = plt.colorbar(plot, shrink=0.7)
plt.savefig('test_plot_'+colormap_name+'.png', bbox_inches='tight', dpi=100)
if __name__ == '__main__':
main()
Plot results#