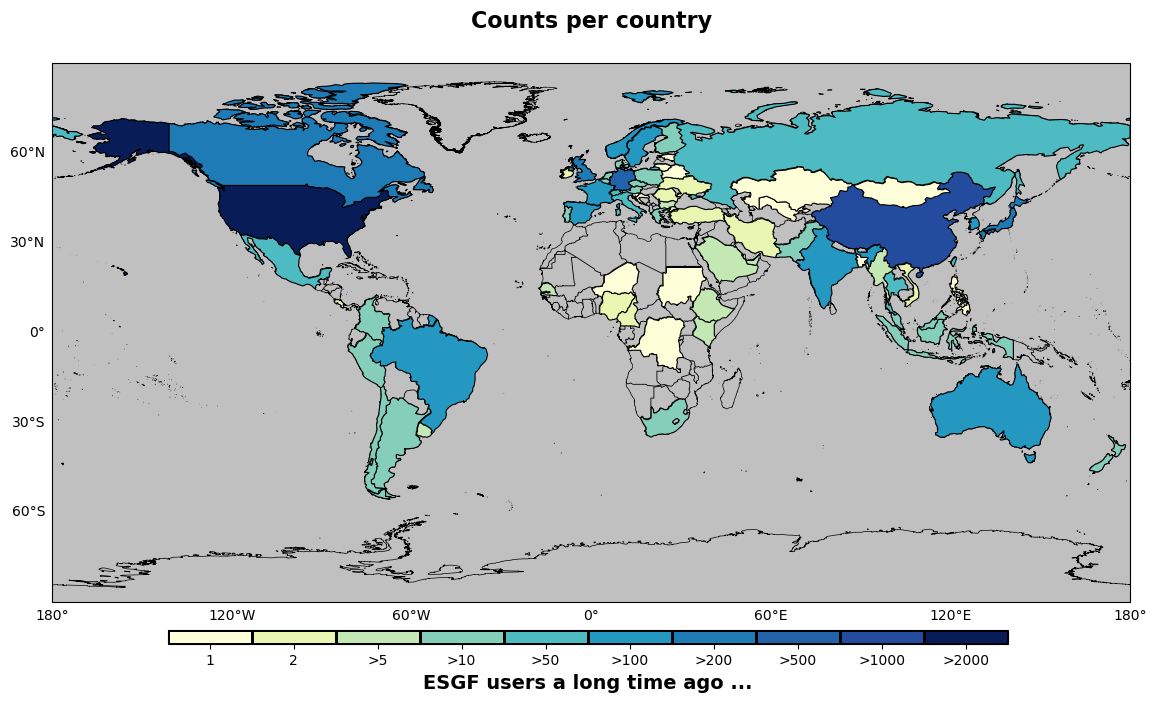
Python counts per country#
Software requirements:
Python 3
numpy
pandas
matplotlib
cartopy
Example script#
counts_per_country.py
#!/usr/bin/env python
# coding: utf-8
'''
DKRZ example

Color countries by data

Content

- read CSV data (country; count)
- define value levels, colors, and colorbar labels
- use Cartopy's shapereader to color countries
- create the global map plot
- create custom colorbar without mappable object

This is the equivalent Python script of a DKRZ NCL example.

-------------------------------------------------------------------------------
2022 copyright DKRZ licensed under CC BY-NC-SA 4.0
               (https://creativecommons.org/licenses/by-nc-sa/4.0/deed.en)
-------------------------------------------------------------------------------
'''
import numpy as np
import pandas as pd
import matplotlib.pyplot as plt
from matplotlib import colors as mcolors
import matplotlib.colorbar as colorbar
import cartopy.crs as ccrs
import cartopy.feature as cfeature
import cartopy.io.shapereader as shpreader
from cartopy.feature import ShapelyFeature

def main():

    # Read the CSV data from file
    data =  pd.read_csv('../../data/country_gesamt.txt',
                        names=['Country','count'],
                        sep=';')

    # Get the states
    states = data['Country'].values
    nstates = len(states)
    #print(states)

    # Get the values for the states
    values = data['count'].values
    #print(values)

    # Define the levels and labels for the colors/values.
    levels  =  [1, 2, 5, 10, 50, 100, 200, 500, 1000, 2000]
    labels  =  ['1','2','>5','>10','>50','>100','>200','>500','>1000','>2000']
    nlevels = len(levels)

    # Define a colormap
    cmap_rgb = [[0.997785, 0.999139, 0.846059],
                [0.910127, 0.964937, 0.695640],
                [0.769320, 0.909419, 0.706959],
                [0.521292, 0.812964, 0.731073],
                [0.304483, 0.732118, 0.761430],
                [0.141961, 0.597647, 0.756078],
                [0.122107, 0.483137, 0.712711],
                [0.131949, 0.382745, 0.665467],
                [0.138408, 0.297578, 0.624990],
                [0.031373, 0.113725, 0.345098]]

    colors  = np.arange(len(cmap_rgb))
    icols   = np.zeros(nstates)

    # Generate a listed colormap for plotting
    cmap = mcolors.ListedColormap(cmap_rgb)

    # Generate an array containing the color index for each country by a given
    # value range (levels).
    for i in range(len(states)):
        if(values[i] == levels[0]):
            icols[i] = 0
        if(values[i] > levels[-2]):
            icols[i] = len(colors)-1

        for j in range(nlevels-1):
            if(values[i] > levels[j] and values[i] <= levels[j+1]):
                icols[i] = colors[j]

    icols = icols.astype(int)

    # Use Cartopy's shapereader to get the geometries from the Natural Earth
    # dataset for each country.
    shpfilename = shpreader.natural_earth(resolution='110m',
                                          category='cultural',
                                          name='admin_0_countries')
    reader = shpreader.Reader(shpfilename)
    countries = reader.records()

    # Let's see which attribute keys are available with the country data.
    #ckeys = next(countries).attributes.keys()
    #print(ckeys)

    # We can use the key 'NAME_LONG' to extract the country names and assign it to
    # a list variable.
    list_countries = [country.attributes['NAME_LONG'] for country in reader.records()]
    ncountries = len(list_countries)
    #print(list_countries)

    # In our example some countries won't be identified because the names have
    # changed or they've got split. We can use the list method replace to do that
    # for three countries here, but for the remaining 2 we have to skip them later.
    states = [s.replace('South Korea','Republic of Korea') for s in data['Country'].values]
    states = [s.replace('Russia','Russian Federation') for s in states]
    states = [s.replace('Congo','Democratic Republic of the Congo') for s in states]
    #print(states)

    # Print the count data, the cmap index and the country name in a table.
    #for i in range(nstates):
    #    print('{0:5d} {1:4d}   {2:30s}'.format(values[i], icols[i], states[i]))

    # Two countries, Singapore and Hong Kong, are missing in the Natural Earth
    # dataset (?) and if you want to check it run the next cell.
    flag = 0
    not_found = []

    for name in states:
        for country in list_countries:
            if country == name:
                flag = 1
        if flag == 0:
            not_found.append(name)
        else:
            flag = 0

    print('Countries not found in NaturalEarth dataset: ', not_found)

    # Create the plot

    plt.switch_backend('agg')

    fig, ax = plt.subplots(figsize=(14,7),
                           subplot_kw=dict(projection=ccrs.PlateCarree()))
    ax.set_global()
    gl = ax.gridlines(draw_labels=True)
    gl.top_labels = gl.right_labels = False
    gl.xlines = False
    gl.ylines = False

    ax.add_feature(cfeature.LAND.with_scale('10m'), color='silver')
    ax.add_feature(cfeature.OCEAN.with_scale('10m'), color='silver')
    ax.add_feature(cfeature.COASTLINE.with_scale('10m'), lw=0.5)
    ax.add_feature(cfeature.BORDERS.with_scale('50m'), lw=0.6)
    ax.set_title('Counts per country', fontsize=16, weight='bold', y=1.05)

    for i in range(nstates):
        name = states[i]
        if name not in not_found:       # exclude countries
            s = [country for country in reader.records() \
                         if country.attributes["NAME_LONG"] == name][0]
            shape_feature = ShapelyFeature([s.geometry],
                                           ccrs.PlateCarree(),
                                           facecolor=cmap_rgb[icols[i]],
                                           edgecolor='black',
                                           lw=0.8)
            ax.add_feature(shape_feature)

    #-- add colorbar and write custom labels below each color box
    cax = fig.add_axes([0.21, 0.05, 0.6, 0.02], autoscalex_on=True) #-- x,y,w,h
    cbar = colorbar.Colorbar(cax,
                             orientation='horizontal',
                             cmap=cmap,
                             norm=plt.Normalize(-0.5, len(colors) - 0.5))
    cbar.set_ticks(range(len(colors)))
    cbar.ax.set_xticklabels(labels, fontsize=10)
    cbar.solids.set_edgecolor('black')
    cbar.set_label(label='ESGF users a long time ago ...', weight='bold', fontsize=14)

    plt.savefig('plot_counts_per_country.png', bbox_inches='tight', facecolor='white')


if __name__ == '__main__':
    main()
Plot result#