Python high resolution background image#
Software requirements:
Python 3
matplotlib
cartopy
Example script#
high_resolution_background_image.py
#!/usr/bin/env python
# coding: utf-8
'''
DKRZ example
Load and draw a high resolution images from Natural Earth Data as map background.
The capability of Cartopy to load an image as background of a map is great.
In many cases the Earth's topography is used to be plotted as background of a
map for land or ocean data instead of a single color.
First, we have to look for an image which we have downloaded the image for
August 2004 from the NASA Earth Observation download page
https://neo.gsfc.nasa.gov/view.php?datasetId=BlueMarbleNG&date=2004-08-01
with a high resolution of 0.1 degrees (3600x1800 pixels).
The images have to be stored in a directory together with a JSON file named
images.json that will be read by Cartopy's cartopy.mpl.geoaxes.GeoAxes.background_image()
method (https://scitools.org.uk/cartopy/docs/latest/reference/generated/cartopy.mpl.geoaxes.GeoAxes.html?highlight=background_img#cartopy.mpl.geoaxes.GeoAxes.background_img).
Cartopy finds the image if the environment variable CARTOPY_USER_BACKGROUNDS
is set to the image directory.
Note: The image file NE1_HR_LC_SR_W_DR.tif from the zip file
NE1_HR_LC_SR_W_DR.zip has to be converted to PNG file format.
Example JSON file images.json:
{"__comment__": "JSON file specifying background images. env CARTOPY_USER_BACKGROUNDS, ax.background_img()",
"BlueMarble": {
"__comment__": "Blue Marble Next Generation, Aug 2004, 0.1 degrees",
"__source__": "https://neo.gsfc.nasa.gov/servlet/RenderData?si=526300&cs=rgb&format=JPEG&width=3600&height=1800",
"__projection__": "PlateCarree",
"high": "BlueMarble_3600x1800.png"
},
"BlueMarbleBright": {
"__comment__": "Blue Marble Next Generation, Aug 2004, 0.1 degrees",
"__source__": "https://www.naturalearthdata.com/http//www.naturalearthdata.com/download/10m/raster/NE1_HR_LC_SR_W_DR.zip",
"__projection__": "PlateCarree",
"high": "NE1_HR_LC_SR_W_DR.png"
},
"NaturalEarthRelief": {
"__comment__": "Natural Earth I with shaded Relief, water, and drainage",
"__source__": "https://www.naturalearthdata.com/http//www.naturalearthdata.com/download/10m/raster/NE1_HR_LC_SR_W_DR.zip",
"__projection__": "PlateCarree",
"high": "NE1_HR_LC_SR_W_DR.png"
},
"GrayEarth": {
"__comment__": "Gray Earth with shaded relief, hypsography and ocean bottom, high res",
"__source__": "https://www.naturalearthdata.com/http//www.naturalearthdata.com/download/10m/raster/GRAY_HR_SR_OB.zip",
"__projection__": "PlateCarree",
"high": "GRAY_HR_SR_OB_high_res.png"
}
}
-------------------------------------------------------------------------------
2022 copyright DKRZ licensed under CC BY-NC-SA 4.0
(https://creativecommons.org/licenses/by-nc-sa/4.0/deed.en)
-------------------------------------------------------------------------------
'''
import os
import numpy as np
import matplotlib.pyplot as plt
import cartopy.crs as ccrs
import cartopy.feature as cfeature
def main():
#-- set environment variable CARTOPY_USER_BACKGROUNDS
os.environ['CARTOPY_USER_BACKGROUNDS'] = '../../Backgrounds/'
#-- set projection
projection = ccrs.PlateCarree()
#-- create two plots next to each other
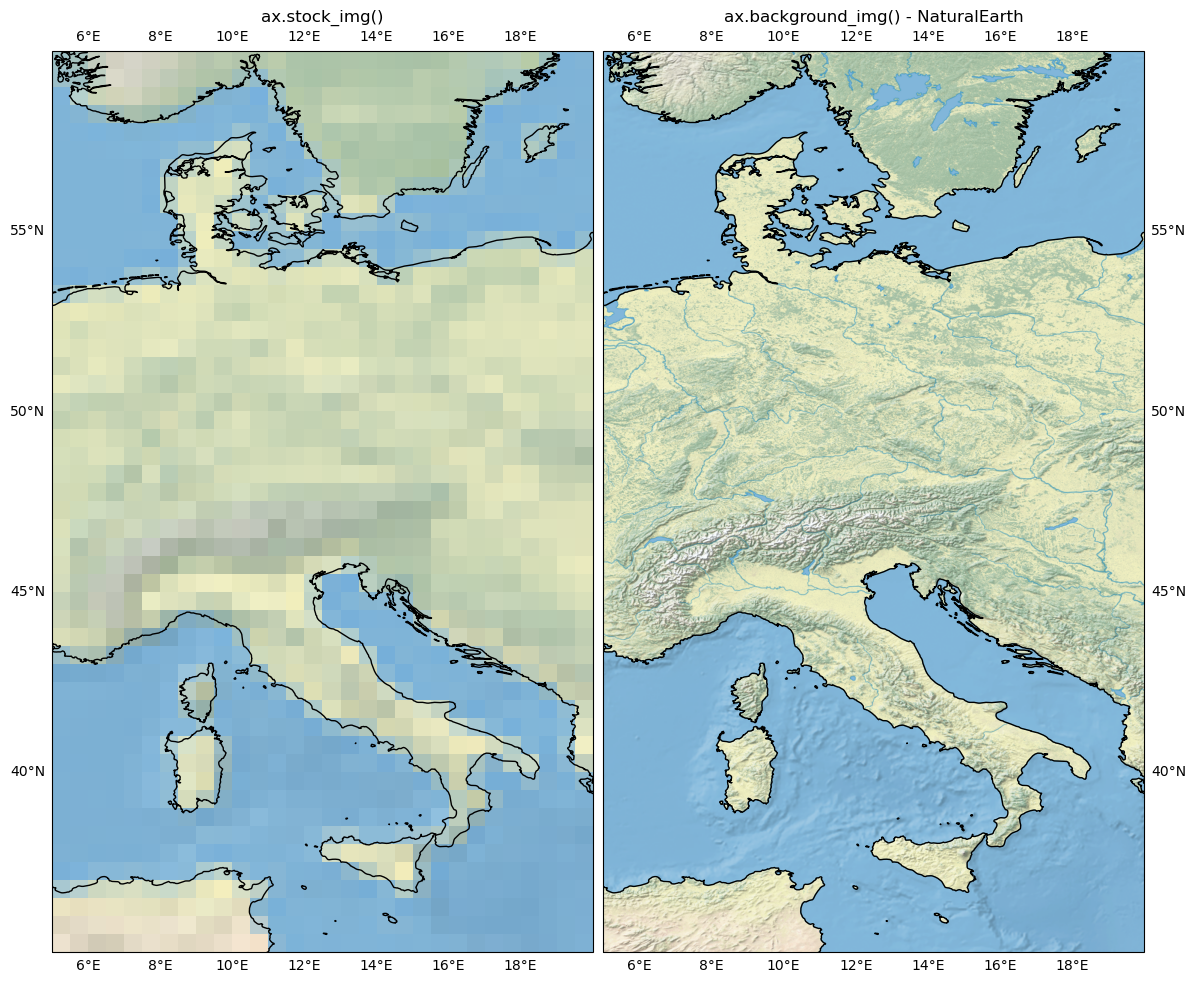
#-- 1. on the left ax.stock_img() is used for map background
#-- 2. on the right the high resolution image from Natural Earth Data is used
plt.switch_backend('agg')
fig = plt.figure(figsize=(12,12))
ax1 = fig.add_subplot(1, 2, 1, projection=projection)
ax2 = fig.add_subplot(1, 2, 2, projection=projection, sharex=ax1, sharey=ax1)
fig.subplots_adjust(bottom=0.05, top=0.95, left=0.04, right=0.95, wspace=0.02)
ax1.set_title('ax.stock_img()')
ax1.set_extent([5., 20., 35.0, 60.0])
ax1.stock_img()
ax1.coastlines(resolution='10m')
gl1 = ax1.gridlines(draw_labels=True)
gl1.xlines = False
gl1.ylines = False
gl1.right_labels = False
ax2.set_title('ax.background_img() - NaturalEarth')
ax2.set_extent([5., 20., 35.0, 60.0])
ax2.background_img(name='NaturalEarthRelief', resolution='high')
ax2.coastlines(resolution='10m')
gl2 = ax2.gridlines(draw_labels=True)
gl2.xlines = False
gl2.ylines = False
gl2.left_labels = False
plt.savefig('plot_high_resolution_background_image.png', bbox_inches='tight', dpi=100)
if __name__ == '__main__':
main()
Plot result#