Python maps#
Software requirements:
Python 3
matplotlib
cartopy
Example script#
matplotlib_map.py
#!/usr/bin/env python
# coding: utf-8
'''
DKRZ example
Generating maps using different map projections with cartopy.
Content
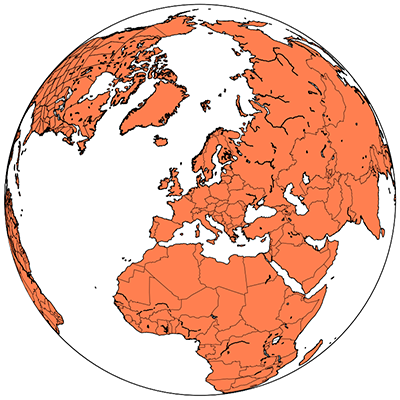
- used map projections: PlateCarree, Orthographic
- color land areas
- add coastlines
- add country borders
- add state provinces
- save to PNG
-------------------------------------------------------------------------------
2021 copyright DKRZ licensed under CC BY-NC-SA 4.0 <br>
(https://creativecommons.org/licenses/by-nc-sa/4.0/deed.en)
-------------------------------------------------------------------------------
'''
import cartopy.crs as ccrs
import cartopy.feature as cfeature
import matplotlib.pyplot as plt
def main():
plt.switch_backend('agg')
proj = [ccrs.PlateCarree(), ccrs.Orthographic(central_latitude=50.0,
central_longitude=10.0)]
provinces = cfeature.NaturalEarthFeature(category='cultural',
name='admin_1_states_provinces_lines',
scale='50m',
facecolor='none')
for i in range(len(proj)):
fig, ax = plt.subplots(figsize=(10,10), subplot_kw=dict(projection=proj[i]))
ax.set_global()
ax.coastlines(linewidth=0.7)
ax.add_feature(cfeature.LAND, zorder=0, color='coral') # color land area
ax.add_feature(cfeature.BORDERS, linewidth=0.2, edgecolor='black')
ax.add_feature(provinces, linewidth=0.2, edgecolor='black')
ax.gridlines(linewidth=0.5, color='gray',
xlocs=range(-180,180,30), ylocs=range(-90,90,30))
plt.savefig(f'plot_matplotlib_map_bbox_{i+1}.png', bbox_inches='tight', dpi=100)
if __name__ == '__main__':
main()
Plot result#