Python vector plot#
Software requirements:
Python 3
matplotlib
cartopy
numpy
xarray
Example script#
matplotlib_vectors.py
#!/usr/bin/env python
# coding: utf-8
'''
DKRZ example
Draws vectors on a map.
Content
- used map projection: PlateCarree
- draw vectors
- add vector reference annotation
- save to PNG
-------------------------------------------------------------------------------
2021 copyright DKRZ licensed under CC BY-NC-SA 4.0 <br>
(https://creativecommons.org/licenses/by-nc-sa/4.0/deed.en)
-------------------------------------------------------------------------------
'''
import xarray as xr
import cartopy.crs as ccrs
import matplotlib.pyplot as plt
def main():
#-- open data set
ds = xr.open_dataset('../../data/rectilinear_grid_2D.nc')
#-- generate the figure
plt.switch_backend('agg')
fig = plt.figure(figsize=(12,6))
ax = plt.axes(projection=ccrs.PlateCarree())
#-- add coastlines and grid lines
ax.coastlines(resolution='50m', linewidth=0.3, color='black')
ax.gridlines(draw_labels=True, linewidth=0.5, color='gray',
xlocs=range(-180,180,30), ylocs=range(-90,90,30))
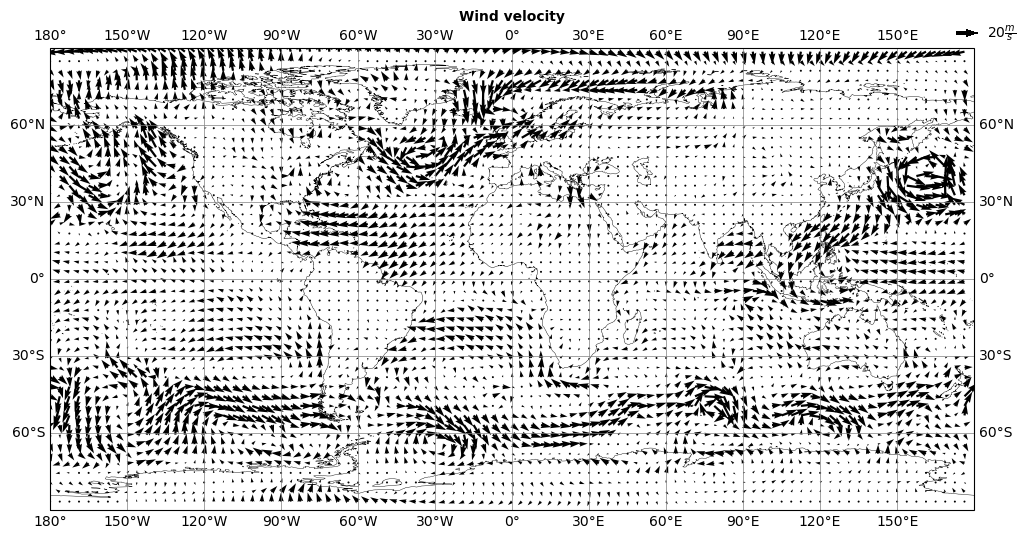
ax.set_title('Wind velocity', fontsize=10, fontweight='bold')
#-- add vectors to the map; thin out every other vector
vplot = ax.quiver(ds.lon[::2], ds.lat[::2],
ds.u10[0,::2,::2],
ds.v10[0,::2,::2],
scale_units='xy',
scale=2.5,
angles='xy',
transform=ccrs.PlateCarree())
#-- add vector reference annotation
vref = ax.quiverkey(vplot, 0.9, 0.905, 20,
r'$20 \frac{m}{s}$',
labelpos='E',
coordinates='figure', zorder=5)
#-- save to PNG
plt.savefig('plot_matplotlib_vector_rect.png', bbox_inches='tight', dpi=100)
if __name__ == '__main__':
main()
Plot result:#