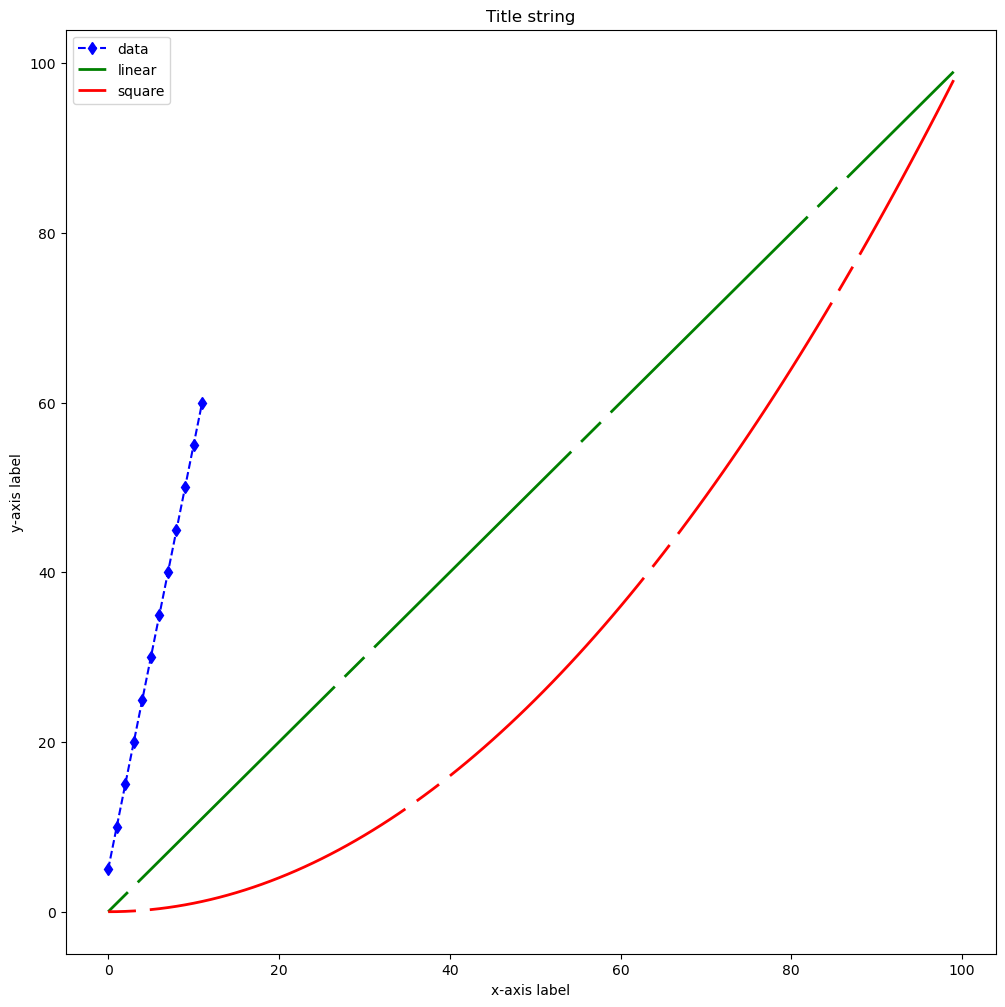
Python xy-plot#
Software requirements:
Python 3
Numpy
matplotlib
Example script#
matplotlib_xy_plot.py
#!/usr/bin/env python
# coding: utf-8
'''
DKRZ example

Create a xy-plot and play with some plot attributes.

Content

- set line attributes
- add a legend
- add a title
- add x-label and y-label

-------------------------------------------------------------------------------
2021 copyright DKRZ licensed under CC BY-NC-SA 4.0 <br>
               (https://creativecommons.org/licenses/by-nc-sa/4.0/deed.en)
-------------------------------------------------------------------------------
'''
import numpy as np
from matplotlib import pyplot as plt

#-----------------------------------------------------------------------
#-- Function: main
#-----------------------------------------------------------------------
def main():
    plt.switch_backend('agg')

    #-- generate example data
    x = np.arange(100)
    data   = np.array([1,2,3,4,5,6,7,8,9,10,11,12]) * 5
    linear = np.arange(100)
    square = [v * v for v in np.arange(0,10,0.1)]

    #-- create the figure
    fig, ax = plt.subplots(figsize=(8,8))

    line0 = ax.plot(data, color='blue', marker='d', markersize=5,
                    linestyle='--', label='data')
    line1 = ax.plot(x, linear, color='g', dashes=[10,5,100,5], linewidth=2,
                    markersize=6, label='linear')
    line2 = ax.plot(x, square, color='r', dashes=[10,5,100,5], linewidth=2,
                    markersize=6, label='square')

    #-- add a legend
    plt.legend(loc='upper left')

    #-- add a annotations
    ax.set_title('Title string')
    ax.set_xlabel('x-axis label')
    ax.set_ylabel('y-axis label')

    #-- maximize and save to PNG file
    plt.savefig('plot_matplotlib_xy_bbox.png', bbox_inches='tight')


if __name__ == '__main__':
    main()
Plot result:
