Python: Font example#
Description
This notebook uses some examples to show how text or labels can be plotted with different fonts or paths.
Software requirements
Python 3
numpy
matplotlib
Example script#
fonts_and_text.py
#!/usr/bin/env python
# coding: utf-8
#
#-- About fonts in a nutshell
#
# 2025 copyright DKRZ licensed under CC BY-NC-ND 4.0
# (https://creativecommons.org/licenses/by-nc-nd/4.0/deed.en)
#
# This notebook uses some examples to show how text/labels can be plotted with
# different fonts or paths.
#
# **rcParam**
#
# - font.family
# - font.style
# - font.variant
# - font.stretch
# - font.weight
# - font.size
#
# **CCS-based generic-family aliases**
#
# - 'cursive'
# - 'fantasy'
# - 'monospace'
# - 'sans'
# - {'sans serif', 'sans-serif', 'serif'}
#
import numpy as np
import matplotlib as mpl
import matplotlib.pyplot as plt
import matplotlib.ticker as mticker
import matplotlib.patheffects as path_effects
#-- init output file name increment
save_id = 0
#-- function to save a plot
def save_plot():
global save_id
plt.savefig(f'plot_font_example_{save_id}.png', bbox_inches='tight', dpi=150)
save_id += 1
# List all available fonts
fonts = mpl.font_manager.get_font_names()
#search_font = 'Courier'
#search_font = 'Helvetica'
search_font = 'Comic'
search_font = 'Armen'
print([s for s in fonts if search_font in s])
#-- Default font settings
#
# https://matplotlib.org/stable/api/font_manager_api.html#matplotlib.font_manager.FontProperties
print('Font name: ', mpl.font_manager.FontProperties().get_name())
print('Font family: ', mpl.font_manager.FontProperties().get_family()) #-- same as mpl.rcParams['font.family']
print('Font size: ', mpl.font_manager.FontProperties().get_size())
print('Font size pts: ', mpl.font_manager.FontProperties().get_size_in_points())
print('Font style: ', mpl.font_manager.FontProperties().get_style())
print('Font weight: ', mpl.font_manager.FontProperties().get_weight())
print('Font variant: ', mpl.font_manager.FontProperties().get_variant())
print('Font stretch: ', mpl.font_manager.FontProperties().get_stretch())
print('Font slant: ', mpl.font_manager.FontProperties().get_slant())
print('Font math font family: ', mpl.font_manager.FontProperties().get_math_fontfamily())
print('Font file: ',
mpl.font_manager.findfont(mpl.font_manager.FontProperties(family=mpl.rcParams['font.family'])))
print('Font fontconfig pattern: ',
mpl.font_manager.FontProperties().get_fontconfig_pattern())
#-- Default font DejaVu
#
# Use the default font settings to draw a string.
fig, ax = plt.subplots()
ax.set_axis_off()
text = ax.text(0.1, 0.5, 'Hello world!', ha='right')
plt.show()
#-- Font fallback
#
# If you want to mix some different characters that are not covered by only one
# font you can use the 'font fallback'. This means that Matplotlib trys to get
# the correct characters or glyphs from a list of given fonts.
# The string Հայոց լեզու in the following example is Armenian and means
# 'Armenian language'.
fig, ax = plt.subplots()
ax.set_axis_off()
text = ax.text(0.01, 0.5,
'Use font fallback to switch to Հայոց լեզու (Armenian Language) in same text',
family=['DejaVu Sans',
'.SF Armenian',
'.SF Armenian Rounded'])
plt.show()
#-- Use fontdict
font_settings = dict(size=20, color='red', family='sans-serif', weight='bold')
fig, ax = plt.subplots()
ax.text(0.2, 0.25, 'How to use fontdict', fontdict=font_settings)
ax.text(0.2, 0.75, 'How to use fontdict', **font_settings)
ax.set_xlabel('x-axis label', **font_settings)
ax.set_ylabel('y-axis label', **font_settings);
plt.show()
#-- Change the font
#
# **Note:**
# Changing the Matplotlib resource parameters (`mpl.rcParams`) will affect the
# notebook. It is not always possible to 'reset' the mpl.rcParams['font.sans-serif']
# to the default values. Then the Notebook kernel must be restarted to load
# the changed resources. So, if the font changes or anything else might not give
# the correct result, restart the kernel and run the code cells up to the
# current code cell.
#-- choose whether to use or change the default font setting
#-- for the text, title, and labels
use_defaults=True
if not use_defaults:
print('... change defaults ...')
#-- Make general changes to the rcParams defaults, this is
#-- temporarily used but will affect all following code cells.
#mpl.rcParams['text.usetex'] = False
#mpl.rcParams['font.family'] = 'sans-serif'
mpl.rcParams['font.sans-serif'] = 'Comic Sans MS'
else:
mpl.rcParams['font.sans-serif'] = 'DejaVu Sans'
fig, ax = plt.subplots(figsize=(8,4))
fontdict = dict(size=16, color='red', family='sans-serif', weight='bold')
ax.text(0.05, 0.05, 'How to change the font to Comic Sans MS',
fontname='Comic Sans MS', fontdict=fontdict)
ax.text(0.05, 0.25, 'How to change the font to Arial',
fontname='Arial', fontdict=fontdict)
ax.text(0.05, 0.45, 'How to change the font to Times New Roman',
fontname='Times New Roman', fontdict=fontdict)
ax.text(0.05, 0.65, 'How to change the font to Courier New',
fontname='Courier New', fontdict=fontdict)
ax.text(0.05, 0.85, 'Default font DejaVu Sans', fontdict=fontdict)
#-- use default font but use another font for the axis ticks and labels
if use_defaults:
print('... defaults ...')
#-- change the axis tick value font
for tick in ax.get_xticklabels():
tick.set_fontname('Comic Sans MS')
for tick in ax.get_yticklabels():
tick.set_fontname('Comic Sans MS')
#-- set font name for axis labels
labelfontdict = dict(name='Comic Sans MS')
else:
labelfontdict = {}
ax.set_xlabel('x-axis label', color='blue', weight='bold', **labelfontdict)
ax.set_ylabel('y-axis label', color='green', weight='bold', **labelfontdict);
plt.show()
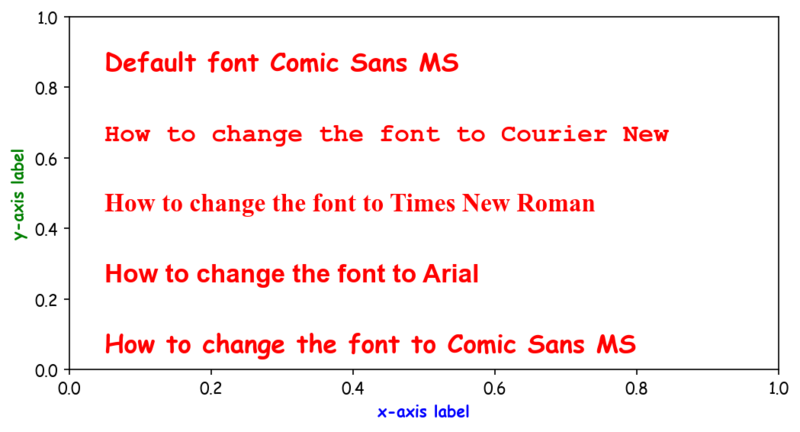
# Another way:
#-- reset to defaults
mpl.rc_file_defaults()
#-- choose whether to use or change the default font setting
#-- for the text, title, and labels
use_defaults = False
if not use_defaults:
print('... change defaults ...')
mpl.rcParams['font.family'] = 'Comic Sans MS'
fig, ax = plt.subplots(figsize=(8,4))
#-- don't use family='sans-serif' in fontdict for COMIC Sans MS
fontdict = dict(size=16, color='red', weight='bold')
ax.text(0.05, 0.05, 'How to change the font to Comic Sans MS',
fontname='Comic Sans MS', fontdict=fontdict)
ax.text(0.05, 0.25, 'How to change the font to Arial',
fontname='Arial', fontdict=fontdict)
ax.text(0.05, 0.45, 'How to change the font to Times New Roman',
fontname='Times New Roman', fontdict=fontdict)
ax.text(0.05, 0.65, 'How to change the font to Courier New',
fontname='Courier New', fontdict=fontdict)
ax.text(0.05, 0.85, 'Default font Comic Sans MS', fontdict=fontdict)
labelfontdict = {}
else:
print('... use defaults ...')
mpl.rc_file_defaults()
fig, ax = plt.subplots()
fontdict = dict(size=16, color='red', family='sans-serif', weight='bold')
ax.text(0.05, 0.05, 'How to change the font to Comic Sans MS',
fontname='Comic Sans MS', fontdict=fontdict)
ax.text(0.05, 0.25, 'How to change the font to Arial',
fontname='Arial', fontdict=fontdict)
ax.text(0.05, 0.45, 'How to change the font to Times New Roman',
fontname='Times New Roman', fontdict=fontdict)
ax.text(0.05, 0.65, 'How to change the font to Courier New',
fontname='Courier New', fontdict=fontdict)
ax.text(0.05, 0.85, 'Default font DejaVu Sans', fontdict=fontdict)
labelfontdict = {}
ax.set_xlabel('x-axis label', color='blue', weight='bold', **labelfontdict)
ax.set_ylabel('y-axis label', color='green', weight='bold', **labelfontdict);
#-- save plot
save_plot()
print(f'--> save_id = {save_id}')
plt.show()
#-- Reset to default font
mpl.rc_file_defaults()
#-- Change the automatic 'offset text'
#
# Matplotlib automatically change the scale of the y-axis values (auto-scaled
# graph) and displays the exponential notation at the upper-left corner of the
# plot.
#
# Change the default offset value notation at the upper-left corner.
fig, (ax1, ax2) = plt.subplots(1, 2, figsize=(8,3), layout='tight')
fig.subplots_adjust(wspace=1)
y = 10000
data = [y + i for i in range(10)]
#-- left axis
ax1.plot(data)
ax1.set_title('default yaxis exponential notation', y=1.1)
#-- right axis
ax2.plot(data)
ax2.set_title('turn off yaxis "offsetText"', y=1.1)
ax2.yaxis.offsetText.set_visible(False)
ax2.text(-0.4, max(data)+0.7, f'*{y:{len(str(y))}.0f}',
color='r', size='small');
plt.show()
# Change the format of the offset notation and add it to the y-axis label. To
# do this you have to change the formatter and redraw the figure canvas to
# update the auto-scale graph.
fig, (ax1, ax2) = plt.subplots(1, 2, figsize=(8,3), layout='tight')
fig.subplots_adjust(wspace=1)
y = 10000
data = [y + i for i in range(10)]
#-- left plot
ax1.plot(data)
ax1.set_title('default yaxis exponential notation', y=1.1)
ax1.set_ylabel('y-axis label')
#-- right plot
ax2.plot(data)
ax2.set_title('change yaxis "offsetText" format', y=1.1)
#-- change formatter and update the axis by re-draw the canvas
formatter = mticker.ScalarFormatter(useMathText=True)
formatter.set_powerlimits((-3,2))
ax2.yaxis.set_major_formatter(formatter)
fig.canvas.draw()
#-- change font size and color of the offset text
ax2.yaxis.get_offset_text().set_fontsize(8)
ax2.yaxis.get_offset_text().set_color('red')
#-- get the y-axis offset text and append it to the ylabel
offset = ax2.yaxis.get_major_formatter().get_offset()
ax2.set_ylabel('y-axis label '+offset);
plt.show()
# Mixed font sizes
#
# LaTex font sizes:
# \tiny \normalsize \huge
# \scriptsize \large \Huge
# \footnotesize \Large
# \small \LARGE
#
# If the LaTeX notation is not rendered correctly re-run the code cell a second time to make sure the `mpl.rcParams['text.usetex'] = True` works as expected. This is a typical LaTeX interpreter behavior.
mpl.rcParams['text.usetex'] = True
fig, ax = plt.subplots()
ax.set_title(r'{\small{This is small}} \ and \ {\Huge{this is big}}')
sizes = ['\\tiny', '\\scriptsize', '\\footnotesize', '\\small',
'\\normalsize', '\\large', '\\Large', '\\LARGE',
'\\huge', '\\Huge']
for i,fs in enumerate(sizes):
ax.text(0.05+(0.05*i), 0.02+(0.08*i), r'{}'.format(fs +' '+ 'Hello world!'));
plt.show()
#-- Try to change the font type of the axis tick labels
#
# **Note:** There is just a small set of fonts available for LaTeX in Matplotlib!
#
# Serif:
# - Computer Modern Roman
# - Palatino (mathpazo)
# - Times (mathptmx)
# - Bookman (bookman)
# - New Century Schoolbook (newcent)
# - Charter (charter)
#
# Sans-serif:
# - Computer Modern Serif
# - Helvetica (helvet)
# - Avant Garde (avant)
#
# Cursive:
# - Zapf Chancery (chancery)
#
# Monospace:
# - Computer Modern Typewriter, Courier (courier)
#
# https://matplotlib.org/stable/users/explain/text/usetex.html
new_font = 'Avant Garde'
#-- set resource params
#-- LateX settings
mpl.rcParams['text.usetex'] = True
#-- add sans-serif fonts for math-text; single or multiple fonts
mpl.rc('text.latex', preamble=r'\usepackage{sfmath} \usepackage{amsmath}')
#-- font settings
mpl.rcParams['font.family'] = 'sans-serif'
mpl.rcParams['font.sans-serif'] = new_font
#-- create the figure
fig, ax = plt.subplots()
ax.set_title(r'{\small{This is small}} \ and \ {\Huge{this is Huge}}');
#-- font sizes
sizes = ['\\tiny', '\\scriptsize', '\\footnotesize', '\\small',
'\\normalsize', '\\large', '\\Large', '\\LARGE',
'\\huge', '\\Huge']
#-- write increasing string
for i,fs in enumerate(sizes):
ax.text(0.05+(0.05*i), 0.02+(0.09*i), r'{}'.format(fs +' '+ '1,2,3,4 Hello world!'))
#-- tick values font
for tick in ax.get_xticklabels():
tick.set_fontfamily('sans-serif')
tick.set_fontname(new_font)
for tick in ax.get_yticklabels():
tick.set_fontfamily('sans-serif')
tick.set_fontname(new_font)
#-- axis labels font
labelfontdict = {}
ax.set_xlabel('x-axis label', color='blue', weight='bold', **labelfontdict)
ax.set_ylabel('y-axis label', color='green', weight='bold', **labelfontdict);
plt.show()
# List all Matplotlib resource settings from .matplotlibrc and its changes.
#mpl.rcParams
# **Note:** The following example demonstrates how to get the position and
# labels of the axis ticks.
x,y = ax.get_xticklabels()[0].get_position()
print(x,y)
text = ax.get_xticklabels()[0].get_text()
print(text)
# ## Accents and "Umlaute"
fig, ax = plt.subplots()
ax.set_axis_off()
mpl.rc_file_defaults()
mpl.rcParams['text.usetex'] = False
uml = r'$\ddot{A} \: \ddot{a} \: \ddot{O} \: \ddot{o} \: \ddot{U} \: \ddot{u} $'
acute = r'$\acute{e} \: \grave{e} $'
arrow_up = r'$\hat{O} $'
vector = r'$\vec{q} $'
size = 12
ax.text(0.1, 0.85, uml, fontsize=size)
ax.text(0.1, 0.65, acute, fontsize=size)
ax.text(0.1, 0.45, arrow_up, fontsize=size)
ax.text(0.1, 0.25, vector, fontsize=size)
ax.set_title(r'$\ddot{o} \: \acute{e} \: \grave{e} \: \hat{O} '
r'\breve{i} \: \bar{A} \: \tilde{n} \: \vec{q} $',
loc='left', fontsize=20)
#-- shortkeys (not really better readable)
ax.text(0.4, 0.8, r"$F=m\ddot{x}$", fontsize=size)
ax.text(0.4, 0.5, r'''$\"o \: \ddot o \: \'e \: \`e \: \~n \: \.x \: \^y$''',
fontsize=size);
plt.show()
#-- Font demo (Matplotlib)
#
# https://matplotlib.org/stable/gallery/text_labels_and_annotations/fonts_demo.html#sphx-glr-gallery-text-labels-and-annotations-fonts-demo-py
# Background text box - bbox
fig, ax = plt.subplots()
ax.set_axis_off()
ax.grid()
#-- square (default) box
txbox_kw = dict(facecolor='yellow', edgecolor='black')
text = ax.text(0.1, 0.1, 'default', fontsize=16, bbox=txbox_kw)
#-- round box
txbox_kw.update(dict(boxstyle='round', linewidth=1, linestyle='--'))
text = ax.text(0.1, 0.25, 'round', fontsize=16, bbox=txbox_kw)
#-- sawtooth box
txbox_kw.update(dict(boxstyle='sawtooth', linewidth=0.5, linestyle='-'))
text = ax.text(0.1, 0.4, 'sawtooth', fontsize=16, bbox=txbox_kw)
#-- roundtooth box
txbox_kw.update(dict(boxstyle='roundtooth', linewidth=0.5, linestyle='-'))
text = ax.text(0.1, 0.55, 'roundtooth', fontsize=16, bbox=txbox_kw)
#-- larrow, rarrow, darrow
txbox_kw.update(dict(boxstyle='larrow', linewidth=0.5, linestyle='-'))
text = ax.text(0.12, 0.72, 'larrow', fontsize=16, bbox=txbox_kw)
txbox_kw.update(dict(boxstyle='rarrow'))
text = ax.text(0.45, 0.72, 'rarrow', fontsize=16, bbox=txbox_kw)
txbox_kw.update(dict(boxstyle='darrow'))
text = ax.text(0.8, 0.72, 'darrow', fontsize=16, bbox=txbox_kw)
#-- round box
txbox_kw.update(dict(boxstyle='round4', linewidth=1, linestyle='--'))
text = ax.text(0.45, 0.25, 'round4', fontsize=16, bbox=txbox_kw)
#-- circle box
txbox_kw.update(dict(boxstyle='circle', linewidth=1, linestyle='-',
facecolor='red', alpha=0.5))
text = ax.text(0.8, 0.15, 'circle', fontsize=16, bbox=txbox_kw)
#-- ellipse box
txbox_kw.update(dict(boxstyle='ellipse', linewidth=0.5, linestyle='-'))
text = ax.text(0.8, 0.4, 'ellipse', fontsize=16, bbox=txbox_kw)
plt.show()
# Math equations
fig, ax = plt.subplots()
#fig, ax = plt.subplots(figsize=(2,0.5), layout='tight')
ax.set_axis_off()
text = ax.text(0.02, 0.5, r'Math formular: $circumference = 2*\pi*r$')
plt.show()
#-- Artists
#
# Path effects
fig, ax = plt.subplots()
#fig, ax = plt.subplots(figsize=(2,1))
ax.set_axis_off()
text = ax.text(0.02, 0.5, 'Text outlines', color='silver', fontsize=36, va='center')
text.set_path_effects([path_effects.Stroke(linewidth=3, foreground='black'),
path_effects.Normal()])
plt.show()
#---
fig, ax = plt.subplots()
ax.set_axis_off()
text = ax.text(0.02, 0.5, 'Text with a shadow', fontsize=36, va='center')
text.set_path_effects([path_effects.PathPatchEffect(offset=(4, -4),
hatch='xxxxx',
linewidth=0.4,
facecolor='silver'),
path_effects.PathPatchEffect(edgecolor='white',
linewidth=1.1,
facecolor='black')])
#- change the hatches linewidth
mpl.rcParams['hatch.linewidth'] = 0.4
plt.show()
#---
fig, ax = plt.subplots()
#fig, ax = plt.subplots(figsize=(2,0.5), layout='tight')
ax.set_axis_off()
text = ax.text(0.02, 0.5, 'Text with a shadow', fontsize=36, weight='bold')
text.set_path_effects([path_effects.PathPatchEffect(offset=(4, -4),
hatch='.....',
edgecolor='grey',
facecolor='silver'),
path_effects.PathPatchEffect(linewidth=1.1,
edgecolor='cyan',
facecolor='black')])
#- change the hatches linewidth
mpl.rcParams['hatch.linewidth'] = 1.
plt.show()
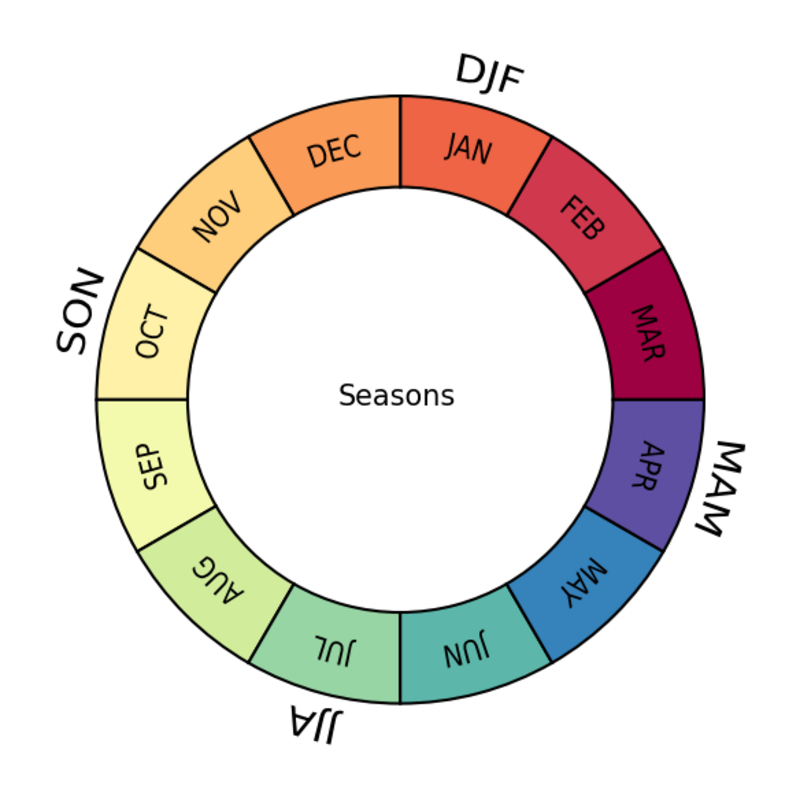
# Circular annotations
from matplotlib.textpath import TextPath
from matplotlib.patches import PathPatch
#mpl.rc_file_defaults()
#-- annotate the pie chart sections (pie slice)
def add_pie_slice_text(text, angle, radius=1, scale=0.01, y=0.):
text_path = TextPath((0, 0), text, size=10)
text_path.vertices.flags.writeable = True
vertices = text_path.vertices
xmin, xmax = vertices[:, 0].min(), vertices[:, 0].max()
ymin, ymax = vertices[:, 1].min(), vertices[:, 1].max()
vertices -= (xmin+xmax)/2, (ymin+ymax)/2
vertices *= scale
for i in range(len(vertices)):
theta = angle - vertices[i, 0]
vertices[i, 0] = (radius-y + vertices[i, 1]) * np.cos(theta)
vertices[i, 1] = (radius-y + vertices[i, 1]) * np.sin(theta)
patch = PathPatch(text_path, facecolor='k', linewidth=0)
ax.add_artist(patch)
#-- create the figure and axis
fig, ax = plt.subplots()
ax.set_aspect(1.0)
#-- Choose 12 colors from Spectral colormap
colors = mpl.cm.Spectral(np.linspace(0, 1, 12))
#-- draw pie chart (circular band with 12 sections),
#-- set size of the circular band width of the pie chart
size = 0.3
ax.pie(np.ones(12), radius=1, colors=colors,
wedgeprops=dict(width=size, edgecolor='black'))
#-- get the month names as 3 character abbreviations
import calendar
text_list = [m.upper() for m in list(calendar.month_abbr[1:])]
#-- add annotations
for i in range(12):
add_pie_slice_text(text_list[i], angle=(2.5-i)*2*np.pi/12, radius=1-0.5*size, y=0.)
seasons = ['MAM','JJA','SON','DJF']
for i in range(len(seasons)):
add_pie_slice_text(seasons[i], angle=(11.5-i*3)*2*np.pi/12,
radius=1+size, scale=0.0125, y=0.2)
fig.text(0.51, 0.49, 'Seasons', ha='center');
#-- save plot
save_plot()
print(f'--> save_id = {save_id}')
plt.show()
Plot result#