Python: legends#
Description
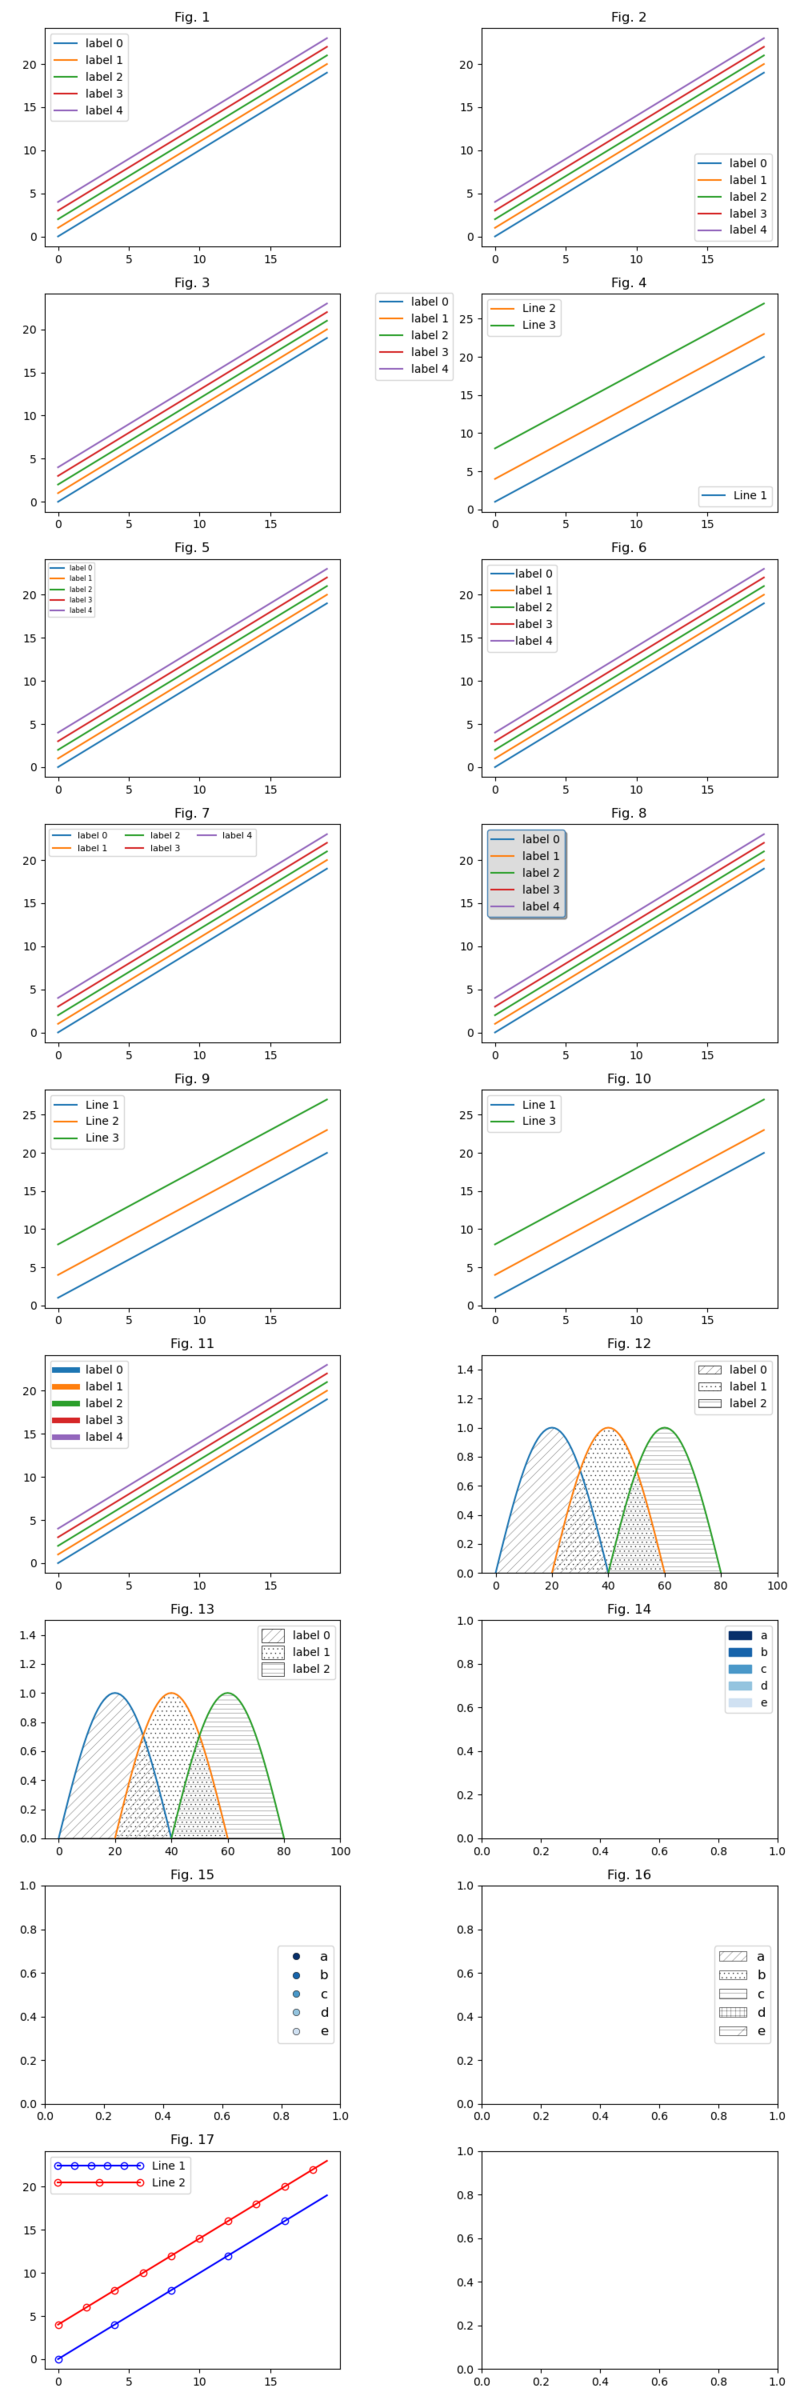
After repeated searches for special settings on the subject of legends, this notebook provides a short overview.
Default legend
Legend location
Split legend
Label font size
Space between line and label
Lines and columns
Legend box border and fill color
Change the legend labels
Legend line widths
Change marker/hatch boxes border lines
Patches and Markers
Control the number of markers in legend lines
Software requirements
Python 3
numpy
matplotlib
Example script#
about_legends.py
#!/usr/bin/env python
# coding: utf-8

'''
# DKRZ tutorial

## About legends in a nutshell

2025 copyright DKRZ licensed under CC BY-NC-SA 4.0
               (https://creativecommons.org/licenses/by-nc-sa/4.0/deed.en)

After repeated searches for special settings on the subject of legends, this
notebook provides a short overview.

+ Default legend
+ Legend location
+ Split legend
+ Label font size
+ Space between line and label
+ Lines and columns
+ Legend box border and fill color
+ Change the legend labels
+ Legend line widths
+ Change marker/hatch boxes border lines
+ Patches and Markers
+ Control the number of markers in legend lines

https://matplotlib.org/stable/api/_as_gen/matplotlib.pyplot.legend.html
https://matplotlib.org/stable/users/explain/axes/legend_guide.html
'''

import copy
import numpy as np

import matplotlib as mpl
import matplotlib.pyplot as plt
import matplotlib.lines as mlines
import matplotlib.patches as mpatches
from matplotlib.legend_handler import HandlerLine2D

# Dummy data
x = np.arange(0, 20, 1)
y = np.arange(0, 20, 1)

fig,axes = plt.subplots(nrows=9, ncols=2, figsize=(10,30), layout='tight')

# Default legend

axes[0,0].set_title('Fig. 1')

for i in range(5):
    axes[0,0].plot(x, y+i, label=f'label {i}')

axes[0,0].legend()

# Legend location
#
# The legend location can be changed with the `loc` keyword.

axes[0,1].set_title('Fig. 2')

for i in range(5):
    axes[0,1].plot(x, y+i, label=f'label {i}')

axes[0,1].legend(loc='lower right');

# Move the legend out of the axis area using the `bbox_to_anchor` keyword.
#
# 2-tuple input: (x, y)
# 4-tuple input: (x, y, width, height)

axes[1,0].set_title('Fig. 3')

for i in range(5):
    axes[1,0].plot(x, y+i, label=f'label {i}')

axes[1,0].legend(bbox_to_anchor=(0.9,0.53,0.5,0.5))

# Split legend
#
# When using two `ax.legend()` commands only the last will be drawn (the
# last overwrite the prior one). Therefore you have to add the first
# legend object using the `ax.add_artist()` function as shown in the
# next example.

axes[1,1].set_title('Fig. 4')

line1, = axes[1,1].plot(x, y+1, label='Line 1')
line2, = axes[1,1].plot(x, y+4, label='Line 2')
line3, = axes[1,1].plot(x, y+8, label='Line 3')

#-- add first legend
axes[1,1].add_artist(axes[1,1].legend(handles=[line1], loc='lower right'))

#-- draw second legend
axes[1,1].legend(handles=[line2,line3], loc='upper left');

# Label font size
#
# Change the legend label font size with the `prop` keyword.

axes[2,0].set_title('Fig. 5')

for i in range(5):
    axes[2,0].plot(x, y+i, label=f'label {i}')

axes[2,0].legend(prop=dict(size=6));

# Space between line and label
#
# Change the space between the lines/markers and their labels using the
# `handletextpad` keyword.

axes[2,1].set_title('Fig. 6')

for i in range(5):
    axes[2,1].plot(x, y+i, label=f'label {i}')

axes[2,1].legend(handletextpad=0.1);

# Lines and columns
#
# You can use the `ncols` keyword to draw the legend entries in columns.

axes[3,0].set_title('Fig. 7')

for i in range(5):
    axes[3,0].plot(x, y+i, label=f'label {i}')

axes[3,0].legend(ncols=3, prop=dict(size=8));

# Legend box border and fill color
#
# To make the legend box more fancy you can use the shadow keyword to draw
# a small `shadow` below the legend box. In the following example the border
# line color as well as the fill color of the legend box is changed by the
# `edgecolor` and `facecolor` keywords.

axes[3,1].set_title('Fig. 8')

for i in range(5):
    axes[3,1].plot(x, y+i, label=f'label {i}')

axes[3,1].legend(shadow=True, facecolor='gainsboro', edgecolor='steelblue');

# Change the legend labels
#
# Usually a legend will be available when the `label` keyword is set in the
# plot command. If you decide to add a legend and won't want to change the
# plot commands you can use the `labels` keyword in the `ax.legend()` command.

axes[4,0].set_title('Fig. 9')

line1, = axes[4,0].plot(x, y+1)
line2, = axes[4,0].plot(x, y+4)
line3, = axes[4,0].plot(x, y+8)

labels = ['Line 1', 'Line 2', 'Line 3']

axes[4,0].legend(labels=labels);

# For whatever reason, it is possible to display only a part of the generated
# plots (lines) in the legend.

axes[4,1].set_title('Fig. 10')

line1, = axes[4,1].plot(x, y+1)
line2, = axes[4,1].plot(x, y+4)
line3, = axes[4,1].plot(x, y+8)

labels = ['Line 1', 'Line 3']

axes[4,1].legend(handles=[line1, line3], labels=labels);

# Legend line widths
#
# You can change the line widths of each legend line using their handler objects.
# These objects and their labels can be retrieved with the `ax.get_legend_handles_labels()`
# function. Changing the linewidth will also change the plot line widths. To
# avoid this behavior you have to make a copy of the handlers, set the line
# widths, and then commit it using the handles keyword in the `ax.legend()`
# function call.

axes[5,0].set_title('Fig. 11')

for i in range(5):
    axes[5,0].plot(x, y+i, label=f'label {i}')

#-- get the legend entries
handles, labels = axes[5,0].get_legend_handles_labels()

#-- copy handles objects to change only the width of the
#-- legend lines (not the plot lines too)
handles = [copy.copy(obj) for obj in handles]
[obj.set_linewidth(5) for obj in handles]

axes[5,0].legend(handles=handles, labels=labels);

# The linewidth keyword in the `ax.fill_between()` call changes the outline of
# the legend hatch boxes too.
#
# The following `mpl.rcParams['hatch.linewidth'] = 0.2` sets the line width of
# the hatch lines and symbols in the base resources of Matplotlib and will
# affect following hatch plots.

n = 40
x1 = np.arange(n+1)
y1 = np.sin((x1/n)*np.pi)

axes[5,1].set_title('Fig. 12')

axes[5,1].set_xlim(-5, 100)
axes[5,1].set_ylim(0., 1.5)

hatches = ['///', '...', '---']

j = 20
for i in range(3):
    axes[5,1].plot(x1+i*j, y1)
    axes[5,1].fill_between(x1+i*j, y1,
                           facecolor='none',
                           edgecolor='black',
                           linewidth=0.5,      #-- change label hatch boxes lw
                           hatch=hatches[i],
                           label=f'label {i}')

mpl.rcParams['hatch.linewidth'] = 0.2   #-- affects all following hatch plots

axes[5,1].legend();

# Change marker/hatch boxes border lines and sizes
#
# The edgecolor keyword sets the border line of the line/marker/hatches box

axes[6,0].set_title('Fig. 13')

axes[6,0].set_xlim(-5, 100)
axes[6,0].set_ylim(0., 1.5)

hatches = ['///', '...', '---']

j = 20
for i in range(3):
    axes[6,0].plot(x1+i*j, y1)
    axes[6,0].fill_between(x1+i*j, y1,
                           facecolor='none',
                           edgecolor='black',
                           linewidth=0.5,
                           hatch=hatches[i],
                           label=f'label {i}')

mpl.rcParams['hatch.linewidth'] = 0.2

lg = axes[6,0].legend()
for patch in lg.get_patches():
    patch.set_height(12)     #-- size of the small legend boxes
    patch.set_y(-3)          #-- move legend entries downward

# Patches and Markers

# Define some labels and colors.

labels = ['a','b','c','d','e','f']

N = 6
cmap = cmap = mpl.colormaps['Blues_r']
colors = cmap(np.linspace(0, 1, N))

# Plot rectangles instead of lines in the legend.

axes[6,1].set_title('Fig. 14')

lgrect = []
for i in range(5):
    lgrect.append(mpatches.Patch(color=colors[i], label=labels[i]))

axes[6,1].legend(handles=lgrect);

# Plot circles instead of lines in the legend.

axes[7,0].set_title('Fig. 15')

#-- here means the keyword 'color' the legend line color
lgmarker = []
for i in range(5):
    lgmarker.append(mlines.Line2D([], [],
                                  color='none',
                                  marker='o',
                                  markersize=6,
                                  markeredgecolor='black',
                                  markerfacecolor=colors[i],
                                  markeredgewidth=0.4))

axes[7,0].legend(lgmarker, labels, prop=dict(size=12), loc='center right');

# Plot hatches instead of lines in the legend.

hatches = ['///', '...', '---', '+++', '-/-', '****']

axes[7,1].set_title('Fig. 16')

lgmarker = []
for i in range(5):
    lgmarker.append(mpatches.Patch(facecolor='white',
                                   edgecolor='black',
                                   linewidth=0.4,
                                   hatch=hatches[i]))

axes[7,1].legend(lgmarker, labels, prop=dict(size=12), loc='center right');

# Control the number of markers in legend lines
#
# As you can control the number of markers different to the number data points
# the `markevery` keyword in the plot command, you have to use the `handler_map`
# keyword for the legend. Additional you can use the `handlelength`keyword to
# change the length of the lines.

axes[8,0].set_title('Fig. 17')

line1, = axes[8,0].plot(x, y,
                 color='blue',
                 marker='o',
                 markerfacecolor='None',
                 markevery=4,
                 label='Line 1')
line2, = axes[8,0].plot(x, y+4,
                 color='red',
                 marker='o',
                 markerfacecolor='None',
                 markevery=2,
                 label='Line 2')

axes[8,0].legend(handler_map={line1: HandlerLine2D(numpoints=6),
                              line2: HandlerLine2D(numpoints=3)},
                 handlelength=8);

plt.savefig('plot_legend_examples.png')
Plot result#