Python: Create a multi-page PDF file#
Description
After the generation of a plot with Matplotlib’s pyplot.savefig() method it is easy to write the figure to a PDF file. However, if we want to create a PDF file in which several plots are to be saved on different pages, we have to take a different approach here.
Content
Create PDF object
Add metadata to PDF object
Generate multiple plots
Save the plots to PDF object
Write PDF file
Software requirements
Python 3
os
datetime
xarray
matplotlib
cartopy
Example script#
create_pdf_multipage_example.py
#!/usr/bin/env python
# coding: utf-8
#------------------------------------------------------------------------------
# Create multiple PDF files
#
#------------------------------------------------------------------------------
# 2025 copyright DKRZ licensed under CC BY-NC-SA 4.0
# (https://creativecommons.org/licenses/by-nc-sa/4.0/deed.en)
#------------------------------------------------------------------------------
#
# In this example, we explain how to create a multi-page PDF document from
# different plots. Therefore we use the method `PdfPages` from Matplotlib's PDF
# backend. We also show how to add some more metadata to the PDF file.
#
# Matplotlib preset the following metadata: 'Creator', 'Producer', 'CreationDate'
#
#------------------------------------------------------------------------------
import os
import datetime
import xarray as xr
import matplotlib.pyplot as plt
from matplotlib.backends.backend_pdf import PdfPages
import cartopy.crs as ccrs
#------------------------------------------------------------------------------
# Example data
#
# Open example data set.
#------------------------------------------------------------------------------
ds = xr.open_dataset(os.environ['HOME']+'/data/rectilinear_grid_2D.nc')
# Choose variables and color maps.
vars = ['tsurf', 'precip', 'slp']
cmaps = ['RdYlBu_r', 'GnBu', 'PiYG']
# Use LaTex when text, e.g. units, contains a math formula.
LATEX = False
if LATEX:
ds.precip.attrs['units'] = r'$\frac{kg}{m^{2}s}$'
#------------------------------------------------------------------------------
# Page size
#
# Define the figure size in inches, here we want to use DIN A4 in portrait or lanscape mode.
#------------------------------------------------------------------------------
figsize_a4p = (8.27, 11.69)
figsize_a4l = (11.69, 8.27)
#------------------------------------------------------------------------------
# PDF file
#
# Set the PDF output file name.
#------------------------------------------------------------------------------
pdf_filename = 'multiple_pdf_pages.pdf'
# We want to set some additional metadata for the PDF file.
#
# https://matplotlib.org/stable/api/backend_pdf_api.html#matplotlib.backends.backend_pdf.PdfPages
#
# The standard keys are:
# 'Title', 'Author', 'Subject', 'Keywords', 'Creator',
# 'Producer', 'CreationDate', 'ModDate', and 'Trapped'.
#
# Predefined keys:
# 'Creator', 'Producer' and 'CreationDate'.
#
# They can be removed by setting them to None.
pdf_metadata = {'Title' : 'Example PDF creation: Plot pages showing tsurf, precip, and slp',
'Author' : 'DKRZ',
'Subject' : 'Create a 3 pages PDF file',
'Keywords' : 'Matplotlib PDF multipage Author Title Subject ModDate',
'ModDate' : datetime.datetime.today()}
#------------------------------------------------------------------------------
# Example 1
#
# Generate one plot per page of each variable's first time step.
#
# Set the metadata for the PDF object directly when creating it with PdfPages.
#------------------------------------------------------------------------------
with PdfPages(pdf_filename, metadata=pdf_metadata) as pdf:
if LATEX:
plt.rcParams['text.usetex'] = True
else:
plt.rcParams['text.usetex'] = False
for i, var in enumerate(vars):
print(f'-- page {i} : {var}')
data = ds[var].mean(axis=0)
fig, ax = plt.subplots(figsize=figsize_a4l,
subplot_kw=dict(projection=ccrs.PlateCarree()))
ax.coastlines()
ax.gridlines(draw_labels=True)
ax.set_title(ds[var].attrs['long_name'])
plot = ax.contourf(data.lon, data.lat, data, levels=20, cmap=cmaps[i],
transform=ccrs.PlateCarree())
cbar = plt.colorbar(plot, orientation='horizontal', pad=0.05, shrink=0.7)
cbar.set_label(ds[var].attrs['units'])
#-- put more white space around each plot
plt.subplots_adjust(left=0.15, right=0.85, top=0.85, bottom=0.15)
#-- add page numbers
fig.text(0.5, 0.05, f'- {i+1} -')
pdf.savefig(fig)
#plt.show()
plt.close()
pdf.close()
#------------------------------------------------------------------------------
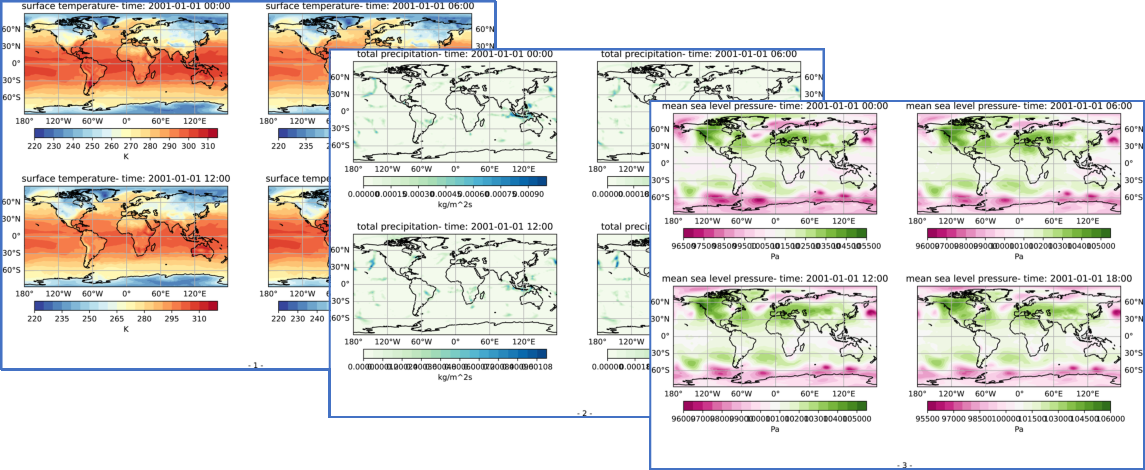
# Example 2
#
# For each variable generate 4 plots showing the data for 4 different time steps.
#
# Set PDF output file name.
#------------------------------------------------------------------------------
pdf_filename = 'multiple_pdf_pages_2.pdf'
# Create the plots and write the resulting figures to the PDF file.
with PdfPages(pdf_filename, metadata=pdf_metadata) as pdf:
if LATEX:
plt.rcParams['text.usetex'] = True
else:
plt.rcParams['text.usetex'] = False
for i, var in enumerate(vars):
print(f'-- page {i} : {var}')
data = ds[var]
fig, axes = plt.subplots(nrows=2, ncols=2, figsize=figsize_a4l,
subplot_kw=dict(projection=ccrs.PlateCarree()))
for t,ax in enumerate(axes.flat):
time_str = ds.time.isel(time=t).dt.strftime('%Y-%m-%d %H:%M').data
ax.coastlines()
gl = ax.gridlines(draw_labels=True)
#-- don't draw top, right or left tick labels
gl.top_labels = False
if t in (0,2):
gl.right_labels = False
else:
gl.left_labels = False
ax.set_title(ds[var].attrs['long_name']+ f'- time: {time_str}')
plot = ax.contourf(data.lon, data.lat, data.isel(time=t), levels=20, cmap=cmaps[i],
transform=ccrs.PlateCarree())
cbar = plt.colorbar(plot, orientation='horizontal', pad=0.1, shrink=0.9)
cbar.set_label(ds[var].attrs['units'])
t += 9
#-- put more white space around each plot
plt.subplots_adjust(left=0.15, right=0.85, top=0.85, bottom=0.15)
#-- add page numbers
fig.text(0.5, 0.05, f'- {i+1} -')
pdf.savefig(fig)
#plt.show()
plt.close()
#------------------------------------------------------------------------------
# Example 3
#
# Same as example 2, but instead of adding the metadata when we create the PDF
# object they will be added after the plot generation.
#
# Set PDF output file name.
#------------------------------------------------------------------------------
pdf_filename = 'multiple_pdf_pages_3.pdf'
# Generate the plots and write the results to a PDF file.
with PdfPages(pdf_filename) as pdf:
if LATEX:
plt.rcParams['text.usetex'] = True
else:
plt.rcParams['text.usetex'] = False
for i, var in enumerate(vars):
print(f'-- page {i} : {var}')
data = ds[var]
fig, axes = plt.subplots(nrows=2, ncols=2, figsize=figsize_a4l,
subplot_kw=dict(projection=ccrs.PlateCarree()))
for t,ax in enumerate(axes.flat):
time_str = ds.time.isel(time=t).dt.strftime('%Y-%m-%d %H:%M').data
ax.coastlines()
gl = ax.gridlines(draw_labels=True)
#-- don't draw top, right or left tick labels
gl.top_labels = False
if t in (0,2):
gl.right_labels = False
else:
gl.left_labels = False
ax.set_title(ds[var].attrs['long_name']+ f'- time: {time_str}')
plot = ax.contourf(data.lon, data.lat, data.isel(time=t), levels=20, cmap=cmaps[i],
transform=ccrs.PlateCarree())
cbar = plt.colorbar(plot, orientation='horizontal', pad=0.1, shrink=0.9)
cbar.set_label(ds[var].attrs['units'])
t += 9
#-- put more white space around each plot
plt.subplots_adjust(left=0.15, right=0.85, top=0.85, bottom=0.15)
#-- add page numbers
fig.text(0.5, 0.05, f'- {i+1} -')
pdf.savefig(fig)
#plt.show()
plt.close()
#-- get pre-defined metadata
md = pdf.infodict()
#-- add metadata
for (key, value) in pdf_metadata.items():
md[key] = value
print(md)
pdf.close()
Plot result#