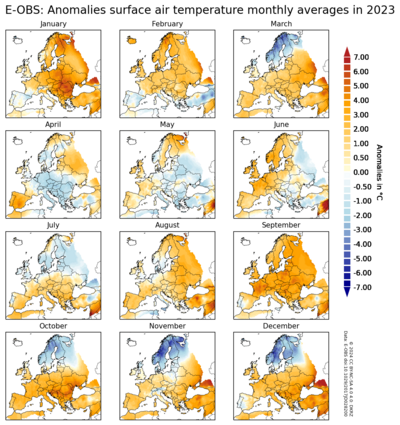
Python generate multiple subplots of monthly anomalies#
In this example we want to show i.a. how the data is processed with python-cdo, generate the panel plot using the Transverse Mercator map projection, and at the end save the figure in a PNG file. The daily surface air temperature data of the E-OBS dataset is used, further information on the data set and its download can be found in the script.
Software requirements:
Python 3
matplotlib
cartopy
python-cdo
Example script#
monthly_anomalies.py
#!/usr/bin/env python
# coding: utf-8
'''
DKRZ example

2023 Surface air temperature anomalies of Europe

Description

 This Python script demonstrates the data processing with python-cdo

 - extract the temperature data for the year 2023
 - compute the monthly means
 - compute the climatology data from the years 1991-2020
 - compute the monthly anomalies for the year 2023

 In this example, we use the surface air temperature daily mean variable
 tg of the E-OBS dataset. The data extraction and computations in this
 notebook are done primarily using the python-CDO package.

------------------------------------------------------------------------------
Data description

From the E-OBS data documentation at CDS:

     The E-OBS daily gridded meteorological data for Europe from 1950 to present
     derived from in-situ observations.
     Gridtype:    regular latlon
     Resolution:  0.25° x 0.25°
     Variables:   Mean temperature in °C

     We acknowledge the E-OBS dataset and the data providers in the ECA&D project
     ( https://www.ecad.eu).
     Cornes, R., G. van der Schrier, E.J.M. van den Besselaar, and P.D. Jones. 2018:
     An Ensemble Version of the E-OBS Temperature and Precipitation Datasets,
     J. Geophys. Res. Atmos., 123. doi:10.1029/2017JD028200

     Download: https://cds.climate.copernicus.eu/cdsapp#!/dataset/10.24381/cds.151d3ec6?tab=overview
     Copernicus Climate Change Service, Climate Data Store, (2020):
     E-OBS daily gridded meteorological data for Europe from 1950 to present
     derived from in-situ observations.
     Copernicus Climate Change Service (C3S) Climate Data Store (CDS).
     DOI: 10.24381/cds.151d3ec6 (Accessed on DD-MMM-YYYY)

------------------------------------------------------------------------------
python-CDO:

 For the computations in this notebook we use the python-CDO package, the Python
 bindings of CDO (Climate Data Operators).
     Schulzweida, Uwe. (2023). CDO User Guide (2.3.0). Zenodo.
     https://doi.org/10.5281/zenodo.10020800

------------------------------------------------------------------------------
Notes:

 - The cartopy map projection Transverse Mercator with a given central_longitude=10.
   leads to a strange behavior of the cartopy.features. Use
   `ccrs.TransverseMercator(central_longitude=11.,central_latitude=50.) ` instead.

-------------------------------------------------------------------------------
2024 copyright DKRZ licensed under CC BY-NC-SA 4.0
               (https://creativecommons.org/licenses/by-nc-sa/4.0/deed.en)
-------------------------------------------------------------------------------
'''
import os
import xarray as xr
import matplotlib.pyplot as plt
import matplotlib.colors as mcolors
import cartopy.crs as ccrs
import cartopy.feature as cfeature
from cdo import Cdo
cdo = Cdo()

def main():
    #------------------------------------------------------------------------------
    # E-OBS daily data
    #
    # Open the dataset of the surface air temperature mean data, if it doesn't exist
    # merge the single tg files using CDO.
    #------------------------------------------------------------------------------
    dpath = os.environ['HOME']+'/data/E-OBS/'
    files = dpath + 'tg_ens_mean_0.25deg_reg_*.nc'
    tg_all = dpath + 'tg_0.25deg_1950-2023.nc'          #-- output file name

    if not os.path.exists(tg_all):
        cdo.mergetime(input=f'{files}', options='-O', output=tg_all)

    #------------------------------------------------------------------------------
    # Compute monthly means
    #
    # First, compute the monthly mean data from the daily data.
    #------------------------------------------------------------------------------
    data_file = dpath + 'tg_2023_monthly_mean.nc'

    if not os.path.exists(data_file):
        cdo.monmean(input=f'-selyear,2023 {tg_all}',
                            options='-O --reduce_dim', output=data_file)

    #------------------------------------------------------------------------------
    # Climatology
    #
    # Compute the 30-years monthly reference data using the time range 1991-2020.
    #------------------------------------------------------------------------------
    ref_time = [1991, 2020]

    clim_file = dpath + 'tg_clim_1991-2020_monthly_mean.nc'

    if not os.path.exists(clim_file):
        cdo.ymonmean(input=f'-selyear,{ref_time[0]}/{ref_time[1]} {tg_all}',
                            options='-O --reduce_dim', output=clim_file)

    #------------------------------------------------------------------------------
    # Anomalies
    #
    # Compute the anomalies for the year 2023.
    #------------------------------------------------------------------------------
    anom_file = dpath + 'tg_2023_anomaly_monthly_mean.nc'

    if not os.path.exists(anom_file):
        cdo.sub(input=f'{data_file} {clim_file}',
                            options='-O --reduce_dim', output=anom_file)

    ds_anom = xr.open_dataset(anom_file)

    lon = ds_anom.longitude
    lat = ds_anom.latitude

    #------------------------------------------------------------------------------
    # Colormap
    #
    # Generate a colormap with colors from dark blue to dark red with white in the middle.
    #------------------------------------------------------------------------------
    color_list4 = ['darkblue', 'lightblue', 'white', 'lightyellow', 'orange',  'firebrick']
    nodes = [0.0, 0.3, 0.5, 0.5, 0.8,  1.0]
    cmap = mcolors.LinearSegmentedColormap.from_list('mybluewhitered', list(zip(nodes, color_list4)))

    #------------------------------------------------------------------------------
    # Map projection and data transformation
    #------------------------------------------------------------------------------
    projection = ccrs.TransverseMercator(central_longitude=11.,
                                        central_latitude=50.,
                                        approx=True)
    transform = ccrs.PlateCarree()

    #------------------------------------------------------------------------------
    # Select variable and change the units attribute.
    #------------------------------------------------------------------------------
    var_anom_mon = ds_anom.tg
    var_anom_mon.attrs['units'] = 'Anomalies in °C'

    #------------------------------------------------------------------------------
    # Set data bounds, norm and colorbar labels.
    #------------------------------------------------------------------------------
    bounds = [-7.0, -6.5, -6.0, -5.5, -5.0, -4.5, -4.0, -3.5, -3.00, -2.50,
              -2.00, -1.50, -1.00, -0.75, -0.50, -0.25,  0.,
               0.25,  0.50,  0.75,  1.00,  1.50,  2.00 ,
              2.50,  3.00 , 3.5, 4.0, 4.5, 5.0, 5.5, 6.0, 6.5, 7.0]

    norm = mcolors.BoundaryNorm(bounds, cmap.N)

    cbar_labels = [f'{x:.2f}' for x in bounds]
    cbar_title  = var_anom_mon.units

    #------------------------------------------------------------------------------
    # Generate the figure
    #------------------------------------------------------------------------------
    plt.switch_backend('agg')

    fig, axes = plt.subplots(nrows=4, ncols=3, figsize=(10,10),
                             subplot_kw=dict(projection=projection))

    fig.suptitle('E-OBS: Anomalies surface air temperature monthly averages in 2023',
                 x=0.142, y=0.93, ha='left', fontsize=16)

    for i, ax in enumerate(axes.flat):
        ax.set_extent([lon.min()+31., lon.max()-35., lat.min()+6., lat.max()-5])
        ax.coastlines(resolution='50m', lw=0.4)
        ax.add_feature(cfeature.BORDERS, lw=0.3)

        ax.set_title(f'{var_anom_mon.time[i].dt.strftime("%B").values}', fontsize=10)

        plot = ax.pcolormesh(lon, lat, var_anom_mon.isel(time=i),
                             cmap=cmap,
                             norm=norm,
                             transform=transform)

        plt.subplots_adjust(wspace=0.0, hspace=0.15)

        #-- add colorbar
        fig.subplots_adjust(right=0.8)
        cbar_ax = fig.add_axes([0.81, 0.35, 0.015, 0.5])
        cbar = fig.colorbar(plot, cax=cbar_ax, cmap=cmap, norm=plt.Normalize(-15,15),
                            extend='both')

        cbar.set_label(cbar_title, rotation=270, labelpad=15, weight='normal')
        cbar.set_ticks(bounds)
        cbar.ax.tick_params(axis='both', length=0)
        #-- hide every 2nd cbar tick label
        for i, x in enumerate(bounds):
            if i % 2:
                cbar_labels[i] = ''
        cbar.set_ticklabels(cbar_labels, weight='normal')
        cbar.solids.set(edgecolor='white', linewidth=1)
        cbar.outline.set(edgecolor='white', linewidth=1)

    #-- add copyright and data information
    dx = 0.011
    x, y = 0.82, 0.12
    fig.text(x,      y, '© 2024 CC BY-NC-SA 4.0 4.0: DKRZ', rotation=270, fontsize=6)
    fig.text(x-dx,   y, 'Data: E-OBS doi:10.1029/2017JD028200', rotation=270, fontsize=6)

    #------------------------------------------------------------------------------
    # Save the figure as PNG file.
    #------------------------------------------------------------------------------
    fig.savefig('plot_anomalies_surface_air_temperature_2023_monthly_means.png',
                 bbox_inches='tight', facecolor='white', dpi=150)


if __name__ == '__main__':
    main()
