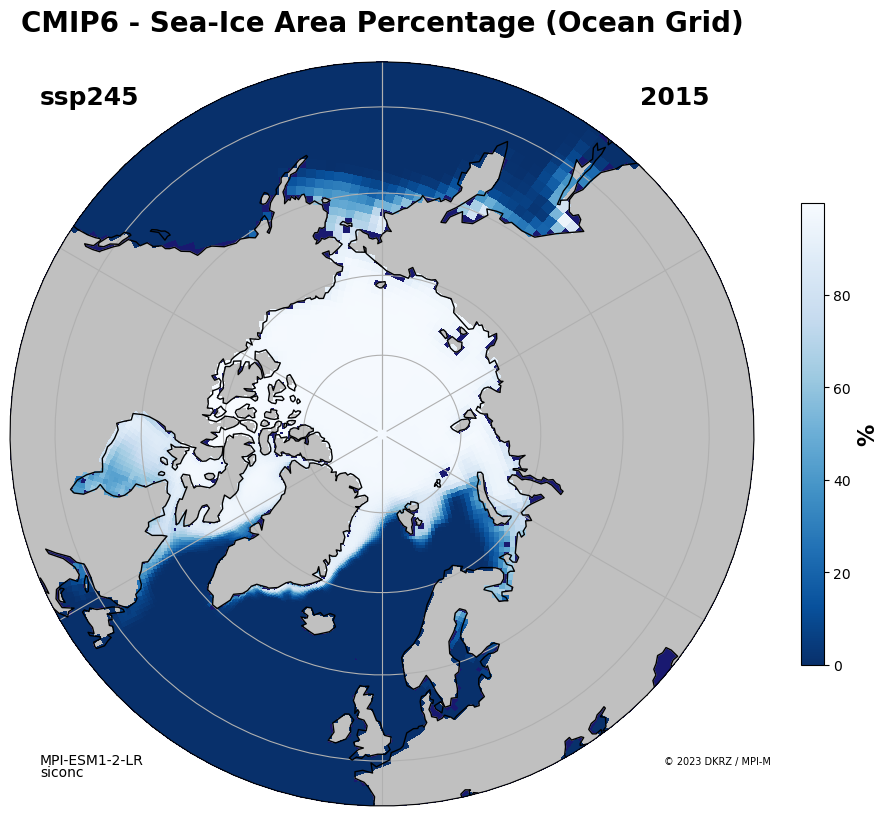
Python sea ice polar plot#
Software requirements:
Python 3
numpy
xarray
matplotlib
cartopy
Example script#
sea_ice_thick_conc_mass_CMIP6.py
#!/usr/bin/env python
# coding: utf-8
'''
DKRZ example

Sea ice data on polar plot

Create a map plot of the sea ice data with North-Polar_Stereographic projection.

Variable siconc: Sea-Ice Area Percentage (Ocean Grid)

-------------------------------------------------------------------------------
2023 copyright DKRZ licensed under CC BY-NC-SA 4.0
               (https://creativecommons.org/licenses/by-nc-sa/4.0/deed.en)
-------------------------------------------------------------------------------
'''
import os
import xarray as xr
import numpy as np

import matplotlib.pyplot as plt
import matplotlib.path as mpath
import cartopy.crs as ccrs
import cartopy.feature as cfeature

# Fix the wrapped lines problem
#
# Function z_masked_overlap()
#
# The function z_masked_overlap was taken from
# https://github.com/SciTools/cartopy/issues/1421 from htonchia
def z_masked_overlap(axe, X, Y, Z, source_projection=None):
    '''
    For data in projection axe.projection
    find and mask the overlaps (more 1/2 the axe.projection range)

    X, Y either the coordinates in axe.projection or longitudes latitudes
    Z the data
    operation one of 'pcorlor', 'pcolormesh', 'countour', 'countourf'

    if source_projection is a geodetic CRS data is in geodetic coordinates
    and should first be projected in axe.projection

    X, Y are 2D same dimension as Z for contour and contourf
    same dimension as Z or with an extra row and column for pcolor
    and pcolormesh

    return ptx, pty, Z
    '''
    if not hasattr(axe, 'projection'):
        return X, Y, Z
    if not isinstance(axe.projection, ccrs.Projection):
        return X, Y, Z
    if len(X.shape) != 2 or len(Y.shape) != 2:
        return X, Y, Z
    if (source_projection is not None and
        isinstance(source_projection, ccrs.Geodetic)):
        transformed_pts = axe.projection.transform_points(
                                   source_projection, X, Y)
        ptx, pty = transformed_pts[..., 0], transformed_pts[..., 1]
    else:
        ptx, pty = X, Y

    with np.errstate(invalid='ignore'):
        # diagonals have one less row and one less columns
        diagonal0_lengths = np.hypot(
                               ptx[1:, 1:] - ptx[:-1, :-1],
                               pty[1:, 1:] - pty[:-1, :-1])
        diagonal1_lengths = np.hypot(
                               ptx[1:, :-1] - ptx[:-1, 1:],
                               pty[1:, :-1] - pty[:-1, 1:])
        to_mask = ((diagonal0_lengths > (
                       abs(axe.projection.x_limits[1]
                           - axe.projection.x_limits[0])) / 2) |
                   np.isnan(diagonal0_lengths) |
                   (diagonal1_lengths > (
                       abs(axe.projection.x_limits[1]
                           - axe.projection.x_limits[0])) / 2) |
                   np.isnan(diagonal1_lengths))
        # TODO check if we need to do something about surrounding vertices
        # add one extra colum and row for contour and contourf
        if (to_mask.shape[0] == Z.shape[0] - 1 and
            to_mask.shape[1] == Z.shape[1] - 1):
            to_mask_extended = np.zeros(Z.shape, dtype=bool)
            to_mask_extended[:-1, :-1] = to_mask
            to_mask_extended[-1, :] = to_mask_extended[-2, :]
            to_mask_extended[:, -1] = to_mask_extended[:, -2]
            to_mask = to_mask_extended
        if np.any(to_mask):
            Z_mask = getattr(Z, 'mask', None)
            to_mask = to_mask if Z_mask is None else to_mask | Z_mask
            Z = np.ma.masked_where(to_mask, Z)

        return ptx, pty, Z


def main():
    plt.switch_backend('agg')

    # LR Scenario data
    ddir = os.environ['HOME']+'/data/CMIP6/LR/SeaIce/Runs/'
    ssps = ['ssp126', 'ssp245', 'ssp370','ssp585']
    fsiconc  = 'LR_SImon_EM_SICONC.nc'
    scen_name = ssps[1]
    path_to_data = ddir + scen_name + '/' + fsiconc

    # Read data
    ds = xr.open_dataset(path_to_data)

    var = ds.siconc.isel(time=0)
    lon = ds.longitude
    lat = ds.latitude

    # Select a time step, retrieve the date string
    timestep = -1

    datestep = var.time.dt.year.data

    # Create pcolormesh plot
    #
    # Note:
    # 1. use the ccrs.Stereographic projection for the transform setting
    # 2. set a circular boundary for the plot
    proj  = ccrs.NorthPolarStereo()
    kwtrans = dict(central_latitude=90, central_longitude=0.)
    trans = ccrs.Stereographic(**kwtrans)

    fig, ax = plt.subplots(figsize=(12,12), subplot_kw={"projection":proj})

    X, Y, maskedZ = z_masked_overlap(ax, lon.data, lat.data, var,
                                     source_projection=ccrs.Geodetic())

    ax.set_extent([-180, 180, 45, 90], ccrs.PlateCarree())
    ax.add_feature(cfeature.OCEAN, color='midnightblue', zorder=0)
    ax.add_feature(cfeature.LAND, color='silver', zorder=1)
    ax.add_feature(cfeature.COASTLINE, zorder=3)
    ax.gridlines()
    ax.set_title('CMIP6 - '+var.attrs['long_name'], y=1.03, fontsize=20, weight='bold')

    plot = ax.pcolormesh(X, Y, maskedZ,
                         cmap='Blues_r',
                         transform=trans,
                         zorder=2)

    cbar = plt.colorbar(plot, ax=ax, shrink=0.5, pad=0.05)
    cbar.set_label(label=var.attrs['units'], size=16, weight='bold')

    # Circular boundary of the map
    # (see https://scitools.org.uk/cartopy/docs/v0.15/examples/always_circular_stereo.html)
    theta  = np.linspace(0, 2*np.pi, 100)
    center = [0.5, 0.5]
    radius =  0.5
    verts  = np.vstack([np.sin(theta), np.cos(theta)]).T
    circle = mpath.Path(verts * radius + center)
    ax.set_boundary(circle, transform=ax.transAxes)

    fig.text(0.15, 0.77, scen_name, weight='bold', fontsize=18)
    fig.text(0.65,  0.77, str(datestep), fontsize=18, weight='bold')
    fig.text(0.15, 0.22, 'MPI-ESM1-2-LR', fontsize=10)
    fig.text(0.15, 0.21, 'siconc', fontsize=10)
    fig.text(0.67, 0.22, '© 2023 DKRZ / MPI-M', fontsize=7)

    fig.savefig('plot_sea_ice_thick_conc_volume_'+scen_name+'.png',
                bbox_inches='tight', facecolor='white', dpi=100)


if __name__ == '__main__':
    main()
Plot result#