Python pressure heights versus time#
Software requirements:
Python 3
numpy
pandas
matplotlib
scipy
metpy
Example script#
pressure_height_vs_time.py
#!/usr/bin/env python
# coding: utf-8
'''
DKRZ example
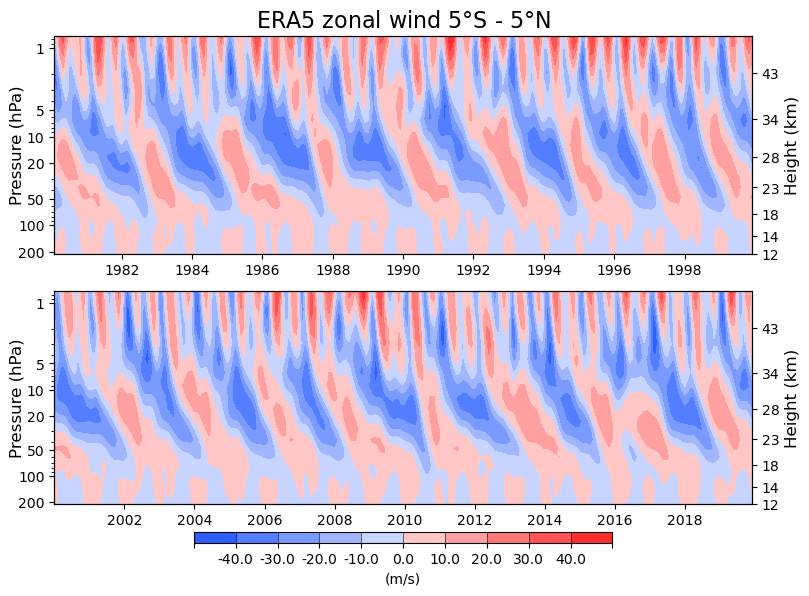
Pressure/height versus time plot
How to create a Quasi-Biennial Oscillation (QBO) Hovmoeller plot.
An NCL script for creating a QBO Hovmoeller plot was used as a template
for this script. Thanks to Frank Sielmann :).
General NCL examples for pressure/height versus time plot see:
https://www.ncl.ucar.edu/Applications/height_time.shtml
Content
- read netCDF file
- create a color map from an NCL color map
- split time series plot into two parts
-------------------------------------------------------------------------------
2024 copyright DKRZ licensed under CC BY-NC-SA 4.0 <br>
(https://creativecommons.org/licenses/by-nc-sa/4.0/deed.en)
-------------------------------------------------------------------------------
'''
import numpy as np
import xarray as xr
import pandas as pd
import matplotlib.pyplot as plt
from matplotlib.ticker import ScalarFormatter
import matplotlib.colors as colors
import scipy.ndimage
#--------------------------------------------------------------------------
# Function get_NCL_colormap(colormap_file, extend='None')
#--------------------------------------------------------------------------
def get_NCL_colormap(colormap_file, extend='None'):
'''Read an NCL RGB colormap file and convert it to a Matplotlib
colormap object.
Parameter:
colormap_file path to NCL RGB colormap file
extend 'None' or 'ncl'
Description:
For example the NCL colormap name "ncl_default" points to the
colormap file $NCARG_ROOT/lib/ncarg/colormaps/ncl_default.rgb
Return Matplotlib Colormap object
'''
import matplotlib.colors as colors
from matplotlib.colors import ListedColormap
with open(colormap_file) as f:
lines = f.read().splitlines()
tmp = [ x for x in lines if '#' not in x ]
tmp = [ x for x in tmp if 'ncolors' not in x ]
tmp = [ x for x in tmp if x != '']
i = 0
for l in tmp:
new_array = np.array(l.split()).astype(float)
if i == 0:
color_list = new_array
else:
color_list = np.vstack((color_list, new_array))
i += 1
if (color_list > 1.).any(): color_list = color_list / 255
# add alpha-channel
alpha = np.ones((color_list.shape[0],4))
alpha[:,:-1] = color_list
color_list = alpha
# define the under, over, and bad colors
under = color_list[0,:]
over = color_list[-1,:]
bad = 'gray'
# convert to Colormap object
if extend == 'ncl':
cmap = ListedColormap(color_list[1:-1,:])
else:
cmap = ListedColormap(color_list)
cmap.set_extremes(under=color_list[0], bad=bad, over=color_list[-1])
return cmap
#--------------------------------------------------------------------------
# Function pressure_to_height(pressure)
#
# The NCL `gsn_geop_hgt(p)` function was used as template of the following
# `pressure_to_height(pressure)` function.
#
# NCL code base: $NCARG_ROOT/lib/ncarg/nclscripts/csm/gsn_csm.ncl
#--------------------------------------------------------------------------
def pressure_to_height(pressure):
'''Convert the given pressure [hPa] to heights in km based on the
1976 U.S. standard atmosphere.
Parameter:
pressure pressure array with units hPa
Description:
The NCL `gsn_geop_hgt(p)` function was used as template of the
following `pressure_to_height(pressure)` function.
NCL code base: $NCARG_ROOT/lib/ncarg/nclscripts/csm/gsn_csm.ncl
Return heights array
'''
import metpy.calc as mpcalc
from metpy.units import units as mpunits
if pressure[0] < pressure[1]:
pres = pressure[::-1]
else:
pres = pressure
# zsa in km
zsa = np.array([-0.3,
0.0, 0.5, 1.0, 1.5, 2.0, 2.5, 3.0,
3.5, 4.0, 4.5, 5.0, 5.5, 6.0, 6.5,
7.0, 7.5, 8.0, 8.5, 9.0, 9.5, 10.0,
11.0, 12.0, 13.0, 14.0, 15.0, 16.0, 17.0,
18.0, 19.0, 20.0, 25.0, 30.0, 35.0, 40.0, 45.0,
50.0, 60.0, 70.0, 80.0, 84.8, 87.7, 90.6,
93.3, 96.1, 97.5,100.4,104.9,
110.0,114.2,116.7,119.7])
# psa in mb (hPa)
psa = np.array([1050.,
1013.25, 954.61, 898.76, 845.59, 795.01, 746.91, 701.21,
657.80, 616.60, 577.52, 540.48, 505.39, 472.17, 440.75,
411.05, 382.99, 356.51, 331.54, 308.00, 285.84, 264.99,
226.99, 193.99, 165.79, 141.70, 121.11, 103.52, 88.497,
75.652, 64.674, 55.293, 25.492, 11.970, 5.746, 2.871, 1.491,
0.798, 0.220, 0.052, 0.010, 0.00485,0.00294,0.000178,
0.000108, 0.0000656, 0.0000511, 0.0000310, 0.0000146,
0.00000691, 0.00000419, 0.00000327, 0.00000254])
if (any(pres < min(psa)) or any(pres > max(psa))):
raise Exception(f'Error: gsn_geop_hgt: Fatal: The pressure values do ',
'not fall between\n',
'{min(psa)} mb and {max(psa)} mb.\n',
'Execution halted.')
npres = pres.size
numsa = len(zsa)
heights = np.zeros(npres)
for i in range(0, npres):
found = False
j = 0
while((not found) and (j <= numsa-2)):
if ((pres[i] <= psa[j]) and (pres[i] >= psa[j+1])):
heights[i] = zsa[j] + (zsa[j+1] - zsa[j]) * np.log( psa[j]/pres[i] ) / \
np.log( psa[j]/psa[j+1] )
found = True
j += 1
#print('pressure_to_height - npres: ', npres)
#print('pressure_to_height - hgt: ', heights)
return heights
#--------------------------------------------------------------------------
def main():
plt.switch_backend('agg')
#-- Choose colormap
#-- Here, we choose a colormap from NCL.
CMAP_PATH = '/sw/spack-levante/ncl-6.6.2-r3hsef/lib/ncarg/colormaps/'
cmap_name = 'BlueRed'
colormap_file = CMAP_PATH + cmap_name + '.rgb'
cmap = get_NCL_colormap(colormap_file, extend='ncl')
#-- Title string
title = r'ERA5 zonal wind $5\degree$S - $5\degree$N'
#-- Read data
#-- Although cftime package is installed a simple xr.open_dataset will
#-- raise a ValueError. The problem is the reference time 'months since'
#-- which is not approved.
infile ='../../data/TOT_ERA5_u_L43_1980_2019_monmean_QBO.nc'
ds = xr.open_dataset(infile, decode_times=False)
#-- get reference time from dataset
_, reference_date = ds.time.attrs['units'].split('since')
#-- add time data to dataset
ds['time'] = pd.date_range(start=reference_date,
periods=ds.sizes['time'],
freq='MS')
#-- Select data
#-- select 20 year-wise
ds1 = ds.sel(time=slice('1980-01-01','1999-12-31'))
ds2 = ds.sel(time=slice('2000-01-01','2019-12-31'))
#-- re-order the dimensions from (time, lev) to (lev, time)
data1 = ds1.uzon.transpose()
data2 = ds2.uzon.transpose()
#-- Time data
time1 = ds1.time
time2 = ds2.time
#print('Time range 1: ', time1.data[0], time1.data[-1])
#print('Time range 2: ', time2.data[0], time2.data[-1])
#-- Pressure data
pressure = ds1.lev
#-- Smooth the data, corresponds to NCL's function `smooth9`.
data1 = xr.DataArray(scipy.ndimage.gaussian_filter(data1, 0.7),
coords={'x':time1, 'y':pressure},
dims=['lev', 'time'])
data2 = xr.DataArray(scipy.ndimage.gaussian_filter(data2, 0.7),
coords={'x':time2, 'y':pressure},
dims=['lev', 'time'])
#-- Define the left y-axis ticks
yticks = np.array([200,100,50,20,10,5,1])
#-- Define contour levels, and colorbar labels
clevels = np.arange(-50., 60., 10.)
clabels = [str(s) for s in clevels]
clabels[0], clabels[-1] = '', ''
#-- Compute the heights with the NCL method
heights = pressure_to_height(pressure)
#print(f'hgt_ncl: \n{heights}')
#-- Plotting the panel
fig, (ax1,ax2) = plt.subplots(nrows=2, ncols=1,
figsize=(9,7),
sharey=True,
gridspec_kw={'height_ratios': [1, 1.3],
'hspace':0.15})
#-- allow us to use the right y-axis labels
axr = ax1.twinx()
axr2 = ax2.twinx()
#------------- upper plot -------------
plot1 = ax1.contourf(time1, pressure, data1, levels=clevels, cmap=cmap)
ax1.set_title(title, fontsize=16)
#-- left y-axis
ax1.set_ylim(ax1.get_ylim()[::-1])
ax1.set_yscale('log')
ax1.set_ylabel('Pressure (hPa)', fontsize=12, labelpad=-5);
ax1.set_yticks(yticks)
ax1.yaxis.set_major_formatter(ScalarFormatter())
#-- right y-axis
pres = pressure[::-1]
YRlabel_inc = 3
axr.set_ylabel('Height (km)', fontsize=12)
axr.set_yscale(ax1.get_yscale())
axr.minorticks_off()
axr.set_yticks(pres[::YRlabel_inc])
axr.set_yticklabels(np.round(heights[::YRlabel_inc]).astype('int'))
axr.set_ylim(ax1.get_ylim())
#------------- lower plot -------------
plot2 = ax2.contourf(time2, pressure, data2, levels=clevels, cmap=cmap)
cbar = plt.colorbar(plot2, orientation='horizontal',
drawedges=True, ticks=clevels,
pad=0.10, shrink=0.6, aspect=40)
cbar.ax.set_xticklabels(clabels)
cbar.set_label('(m/s)')
#-- left y-axis
ax2.set_ylabel('Pressure (hPa)', fontsize=12, labelpad=-5);
#-- right y-axis
axr2.set_ylabel('Height (km)', fontsize=12)
axr2.set_yscale(ax2.get_yscale())
axr2.minorticks_off()
axr2.set_yticks(pres[::YRlabel_inc])
axr2.set_yticklabels(np.round(heights[::YRlabel_inc]).astype('int'))
axr2.set_ylim(ax2.get_ylim())
#-- create the PNG plot
plt.savefig('plot_pres_hgt_time_panel_NCL_heights', bbox_inches='tight')
if __name__ == '__main__':
main()
Plot result: