Python read and use NCL colormaps#
Software requirements:
Python 3
numpy
matplotlib
Example script#
read_and_use_NCL_colormaps.py
#!/usr/bin/env python
# coding: utf-8
'''
DKRZ example

Use NCL colormaps

NCL provides a large collection of colormaps that former NCL users would
like to continue using with Python.

The following function 'get_NCL_colormap' reads an NCL colormap either from
local disk or from an existing NCL installation or directly from the colormaps
URL of NCL. The RGB values are then converted to a Matplotlib Colormap
object that can be used to create colored plots.

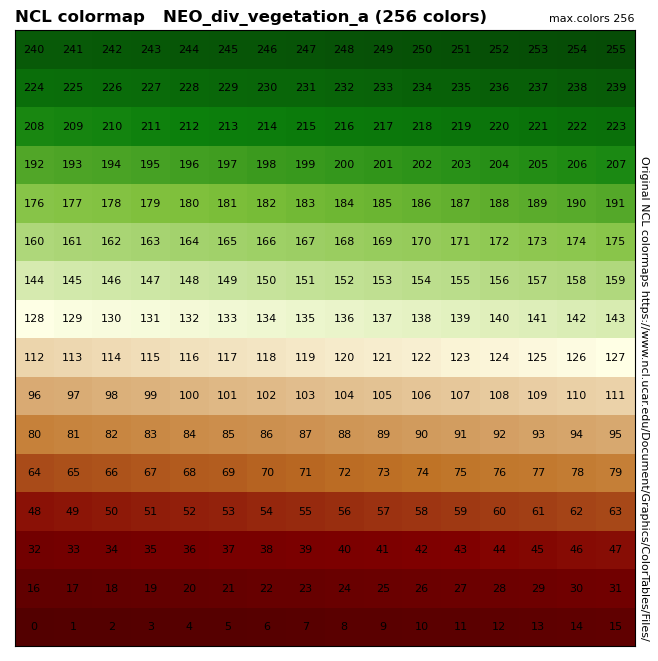
The function 'display_colormap_indices' generates a raster plot using the
given colormap and add the index value to each color box.

-------------------------------------------------------------------------------
2022 copyright DKRZ licensed under CC BY-NC-SA 4.0
               (https://creativecommons.org/licenses/by-nc-sa/4.0/deed.en)
-------------------------------------------------------------------------------
'''
import os, re
import numpy as np
import matplotlib.colors as mcolors
import matplotlib.pyplot as plt

#--------------------------------------------
# Function get_NCL_colormap
# Get the NCL colormap from the original URL.
#--------------------------------------------
def get_NCL_colormap(cmap_name, extend='None'):
    '''Read an NCL RGB colormap file and convert it to a Matplotlib colormap
    object.

    Parameter:
        cmap_name     NCL RGB colormap name, e.g. 'ncl_default'
        extend        use NCL behavior of color handling for the colorbar 'under'
                      and 'over' colors. 'None' or 'ncl', default 'None'

    Description:
        Read the NCL colormap and convert it to a Matplotlib Colormap object.
        It checks if the colormap file is already available or use the
        appropriate URL.

        If NCL is installed the colormap will be searched in its colormaps
        folder $NCARG_ROOT/lib/ncarg/colormaps.

        Returns a Matplotlib Colormap object.
    '''
    from matplotlib.colors import ListedColormap
    import requests
    import errno

    #-- NCL colormaps URL
    NCARG_URL = 'https://www.ncl.ucar.edu/Document/Graphics/ColorTables/Files/'

    #-- read the NCL colormap RGB file
    colormap_file = cmap_name+'.rgb'
    cfile = os.path.split(colormap_file)[1]

    if os.path.isfile(colormap_file) == False:
        #-- if NCL is already installed
        if 'NCARG_ROOT' in os.environ:
            cpath = os.environ['NCARG_ROOT']+'/lib/ncarg/colormaps/'
            if os.path.isfile(cpath + cfile):
                colormap_file = cpath + cfile
                with open(colormap_file) as f:
                    lines = [re.sub('\s+',' ',l)  for l in f.read().splitlines() if not (l.startswith('#') or l.startswith('n'))]
        #-- use URL to read colormap
        elif not 'NCARG_ROOT' in os.environ:
            url_file = NCARG_URL+'/'+cmap_name+'.rgb'
            res = requests.head(url_file)
            if not res.status_code == 200:
                print(f'{cmap_name} does not exist!')
                raise FileNotFoundError(errno.ENOENT, os.strerror(errno.ENOENT), cmap_name)
            content = requests.get(url_file, stream=True).content
            lines = [re.sub('\s+',' ',l)  for l in content.decode('UTF-8').splitlines() if not (l.startswith('#') or l.startswith('n'))]
        else:
            raise FileNotFoundError(errno.ENOENT, os.strerror(errno.ENOENT), colormap_file)
    #-- use local colormap file
    else:
        with open(colormap_file) as f:
            lines = [re.sub('\s+',' ',l)  for l in f.read().splitlines() if not (l.startswith('#') or l.startswith('n'))]

    #-- skip all possible header lines
    tmp  = [l.split('#', 1)[0] for l in lines]

    tmp = [re.sub(r'\s+',' ', s) for s in tmp]
    tmp = [ x for x in tmp if ';' not in x ]
    tmp = [ x for x in tmp if x != '']

    #-- get the RGB values
    i = 0
    for l in tmp:
        new_array = np.array(l.split()).astype(float)
        if i == 0:
            color_list = new_array
        else:
            color_list = np.vstack((color_list, new_array))
        i += 1

    #-- make sure that the RGB values are within range 0 to 1
    if (color_list > 1.).any(): color_list = color_list / 255

    #-- add alpha-channel RGB -> RGBA
    alpha        = np.ones((color_list.shape[0],4))
    alpha[:,:-1] = color_list
    color_list   = alpha

    #-- convert to Colormap object
    if extend == 'ncl':
        cmap = ListedColormap(color_list[1:-1,:])
    else:
        cmap = ListedColormap(color_list)

    #-- define the under, over, and bad colors
    under = color_list[0,:]
    over  = color_list[-1,:]
    bad   = [0.5, 0.5, 0.5, 1.]
    cmap.set_extremes(under=color_list[0], bad=bad, over=color_list[-1])

    return cmap

#---------------------------------------------------------------
# Function display_colormap_indices()
# Add the color index values to the color boxes of the colormap.
#---------------------------------------------------------------
def display_colormap_indices(cmap, colormap_name, txcol='k'):
    '''Display an NCL colormap with max 256 colors.

    Parameter
        cmap            Matplotlib Colormap object
        colormap_name   name of the NCL colormap
        txcol           Font color

    Description
        Create a raster plot of 16x16 color boxes using the given colormap.
    '''
    nx, ny = 16, 16
    data = np.arange(0,256).reshape((nx,ny))

    fig, ax = plt.subplots(figsize=(8,8))
    plot = ax.pcolormesh(np.arange(-0.5,nx+0.5), np.arange(-0.5,ny+0.5), data,
                         cmap=cmap, vmin=0, vmax=cmap.N)
    ax.set_xticks([])
    ax.set_yticks([])

    n = np.arange(0,cmap.N+2)
    k = 0
    for i in range(0,data.shape[1]):
        for j in range(0,data.shape[0]):
            if k >= max(n):
                index = ''
            else:
                index = str(n[k])
            ax.text(j,i,index, ha='center', va='center', fontsize=8, color=txcol)
            k += 1

    tx = ax.set_title(f'NCL colormap', loc='left', weight='bold')
    tx = ax.set_title(f'{colormap_name} ({cmap.N} colors)', loc='center',
                      weight='bold')
    tx = ax.set_title(f'max.colors 256', loc='right', fontsize=8)

    tx = ax.text(0.905, 0.12,
                 'Original NCL colormaps https://www.ncl.ucar.edu/Document/Graphics/ColorTables/Files/',
                 rotation=-90, fontsize=8,
                 transform=plt.gcf().transFigure)

    plt.savefig(colormap_name+'_display.png', bbox_inches='tight', dpi=100)

#-------------------
# Function main()
#-------------------
def main():
    #-- Get NCL colormap
    #
    # The colormap file can be stored on your lokal machine in any directory.
    # If NCL is already installed the colormaps are stored in the directory
    # $NCARG_ROOT/lib/ncarg/colormaps.
    #
    # In this example we want to make sure that we use the original colormap from
    # NCL URL. Therefore, to be on the safe side, we unset the environment variable
    # NCARG_ROOT.
    os.environ.pop('NCARG_ROOT',None)

    #-- Choose the colormap and convert it to the Matplotlib Colormap object.
    # Here are some examples
    colormap1 = 'NEO_div_vegetation_a'
    cmap1     = get_NCL_colormap(colormap1)

    colormap2 = 'BlueWhiteOrangeRed'
    cmap2     = get_NCL_colormap(colormap2)

    colormap3 = 'cmocean_deep'
    cmap3     = get_NCL_colormap(colormap3)

    colormap4 = 'GMT_relief'
    cmap4     = get_NCL_colormap(colormap4)

    #-- Display colormap with indices
    #
    # Let's see how the colormap looks in detail now, therefore we create a
    # 2-d data array of range 0 to ncolors and plot the data with Matplotlib's
    # pcolormesh.
    plt.switch_backend('agg')

    display_colormap_indices(cmap1, colormap1)

    display_colormap_indices(cmap2, colormap2)

    display_colormap_indices(cmap3, colormap3, txcol='white')

    display_colormap_indices(cmap4, colormap4, txcol='gray')

#---------------------------------------

if __name__ == '__main__':
    main()
