Python satellite swath data#
Software requirements:
Python 3
numpy
xarray
matplotlib
cartopy
Example script#
satellite_swath_data.py
#!/usr/bin/env python
# coding: utf-8
'''
DKRZ example
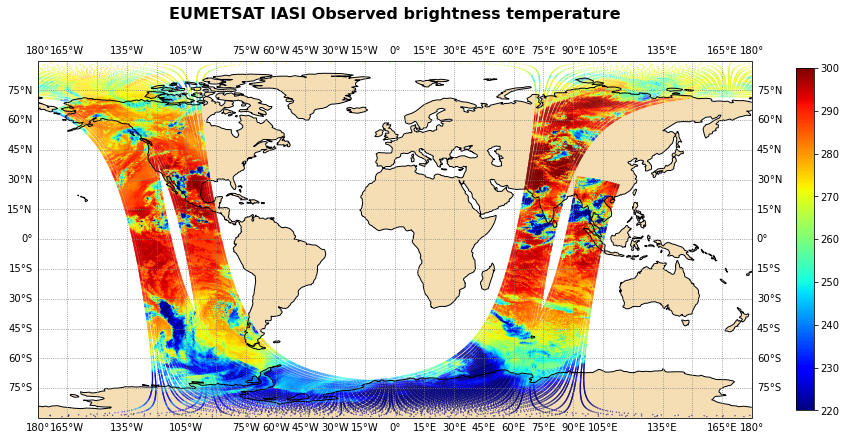
EUMETSAT IASI swath data
Data
Satellite swath data, 3-hourly
Variable
BT_OBS - Observed brightness temperature
Content
- read satellite data
- create the plot
- save as PNG data
-------------------------------------------------------------------------------
2023 copyright DKRZ licensed under CC BY-NC-SA 4.0
(https://creativecommons.org/licenses/by-nc-sa/4.0/deed.en)
-------------------------------------------------------------------------------
'''
import xarray as xr
import numpy as np
import matplotlib.pyplot as plt
import matplotlib.cm as cm
import cartopy.crs as ccrs
import cartopy.feature as cfeature
def main():
# Data path.
infile = '../../data/IASI_004_200907170300-200907170600.nc'
# Name of the output file.
plotfile = "plot_IASI_EUMETSAT_original"
# Select channel to be used.
chan = 2
# Read the data.
ds = xr.open_dataset(infile)
print(ds.BT_OBS)
# Read the data of channel 2 of the BT_OBS variable.
var = ds.BT_OBS[:,chan]
print(var.values.min(), var.values.max())
# Read the coordinates.
lat = ds.LAT
lon = ds.LON
# Define value levels.
levels = np.arange(220.,300.,2.)
nlevels = levels.shape
# Create the scatter plot
plt.switch_backend('agg')
projection = ccrs.PlateCarree()
fig, ax = plt.subplots(figsize=(16,8), subplot_kw={"projection":projection})
ax.set_global()
ax.add_feature(cfeature.LAND, facecolor='wheat')
ax.add_feature(cfeature.OCEAN, facecolor='white')
ax.add_feature(cfeature.COASTLINE)
ax.set_title('EUMETSAT IASI Observed brightness temperature',
fontsize=16,
fontweight='bold',
y=1.1)
gl = ax.gridlines(xlocs=range(-180,181,15),
ylocs=range(-90,91,15),
color='gray',
linestyle='dotted',
draw_labels=True)
plot = ax.scatter(x=lon.values, y=lat.values,
c=var.values,
s=0.1,
vmin=220.,
vmax=300.,
cmap='jet',
transform=ccrs.PlateCarree())
cbar = plt.colorbar(plot, shrink=0.7)
plt.savefig(plotfile, bbox_inches='tight', facecolor='white')
if __name__ == '__main__':
main()
Plot result#