Python plot vectors on maps using different projections#
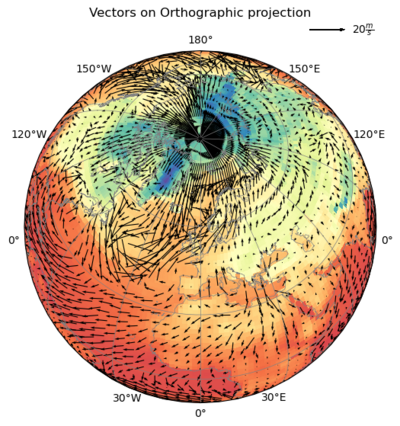
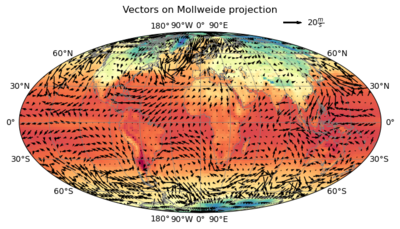
The drawing of vectors on a map is often difficult when you use a map projection different than PlateCarree. In this notebook we give a brief overview and show what needs to be considered.
Software requirements:
Python 3
numpy
xarray
matplotlib
cartopy
Example script#
vectors_and_map_projections.py
#!/usr/bin/env python
# coding: utf-8
'''
------------------------------------------------------------------------------
DKRZ example

Vectors on different projections

The drawing of vectors on a map is often difficult when you use a map projection
different than PlateCarree. In this notebook we give a brief overview and show
what needs to be considered.

The base plot is a contour fill plot of the surface temperature data over which
the wind vectors are to be plotted.

Content

  - PlateCarree
  - Orthographic
  - NorthPolarStereo/SouthPolarStereo
  - Mollweide
  - Robinson

-------------------------------------------------------------------------------
2024 copyright DKRZ licensed under CC BY-NC-SA 4.0 <br>
               (https://creativecommons.org/licenses/by-nc-sa/4.0/deed.en)
-------------------------------------------------------------------------------
'''
import xarray as xr
import numpy as np

import matplotlib.pyplot as plt
import matplotlib.path as mpath
import cartopy.crs as ccrs
import cartopy.feature as cfeature
import cartopy.util as cutil

def main():
    #-- Open example data file
    infile = '../../data/rectilinear_grid_2D.nc'

    ds = xr.open_dataset(infile)

    #-- Assign coordinate and data variables for time step _t_.
    lon = ds.lon
    lat = ds.lat

    t = 0      #-- time index

    var = ds.tsurf.isel(time=t)
    u   = ds.u10.isel(time=t)
    v   = ds.v10.isel(time=t)

    #-- Colormap
    cmap = 'Spectral_r'

    #-- Coordinate reference systems (CRS)
    #
    # Read more about 'Understanding the transform and projection keywords' in the
    # Cartopy documentation: <br>
    # https://scitools.org.uk/cartopy/docs/latest/tutorials/understanding_transform.html
    #
    # For the data CRS we can use PlateCarree.
    data_crs = ccrs.PlateCarree()

    #-- Projections
    #
    # When using map projections the projection CRS has to be used with `plt.subplots()`, `ax.add_subplot()`, `ax.set_global()`, and `ax.set_extent()` (and if needed with the Cartopy features).
    #
    # The vector plots for various map projections are generated below.

    #-- PlateCarree
    #
    # Map projection CRS for the cylindrical equidistant map projection.
    projection = ccrs.PlateCarree()

    # Create contour fill plot and overlay the vectors
    plt.switch_backend('agg')

    fig, ax = plt.subplots(figsize=(8,8), subplot_kw=dict(projection=projection))

    ax.add_feature(cfeature.COASTLINE.with_scale('50m'), edgecolor='grey', linewidth=0.5)
    ax.gridlines(draw_labels=True, linewidth=0.5, color='gray',
                 xlocs=range(-180,180,30), ylocs=range(-90,90,30))

    ax.set_title('Wind velocity', fontsize=10, fontweight='bold')

    cnplot = ax.pcolormesh(lon, lat, var.values,
                           cmap=cmap,
                           transform=data_crs)

    incr = 2  #-- increment to thin out the vectors

    vplot = ax.quiver(lon[::incr], lat[::incr],
                  u[::incr,::incr].values,
                  v[::incr,::incr].values,
                  scale_units='xy',
                  scale=2,
                  angles='xy',
                  transform=data_crs)

    vref = ax.quiverkey(vplot, 0.9, 0.905, 20,
                        r'$20 \frac{m}{s}$',
                        labelpos='E',
                    coordinates='figure', zorder=5)

    #plt.savefig('plot_matplotlib_vector_rect.png', bbox_inches='tight', dpi=100)

    #-- Orthographic projection
    #
    # To use the Orthographic projection either `ax.set_global()` or `ax.set_extent()` has to be used.
    #
    # Map projection CRS
    projection = ccrs.Orthographic(central_longitude=0.,
                                   central_latitude=60.)

    fig, ax = plt.subplots(figsize=(6,6), subplot_kw=dict(projection=projection))

    ax.set_global()

    ax.set_title('Vectors on Orthographic projection', y=1.08)

    ax.add_feature(cfeature.COASTLINE.with_scale('50m'), edgecolor='grey', linewidth=0.5)
    ax.gridlines(draw_labels=True, linewidth=0.5, color='gray',
                 xlocs=range(-180,180,30), ylocs=range(-90,90,30))

    cnplot = ax.pcolormesh(lon, lat, var.values,
                           cmap=cmap,
                           transform=data_crs)

    incr = 2 #-- increment if you want to thin out the vectors

    vplot = ax.quiver(lon[::incr], lat[::incr],
                      u[::incr,::incr].values,
                      v[::incr,::incr].values,
                      angles='xy',
                      scale=200,
                      color='black',
                      transform=data_crs)

    vref = ax.quiverkey(vplot, 0.91, 1.06, 20,
                        r'$20 \frac{m}{s}$',
                        labelpos='E',
                        coordinates='axes',
                        color='k')

    #-- save to PNG
    plt.savefig('plot_matplotlib_vector_ortho.png', bbox_inches='tight', dpi=100)


    #-- Change the map projection CRS to zoom into the map.
    projection = ccrs.Orthographic(central_longitude=14.,
                                   central_latitude=68.)

    # Create the plot
    fig, ax = plt.subplots(figsize=(6,6), subplot_kw=dict(projection=projection))

    ax.set_extent([-10., 30., 50, 80.], crs=data_crs)

    ax.set_title('Vectors on Orthographic projection', y=1.08)

    ax.add_feature(cfeature.COASTLINE.with_scale('50m'), edgecolor='grey', linewidth=0.5)
    ax.gridlines(draw_labels=True, linewidth=0.5, color='gray',
                 xlocs=range(-180,180,30), ylocs=range(-90,90,30))

    cnplot = ax.pcolormesh(lon, lat, var.values,
                           cmap=cmap,
                           transform=data_crs)

    incr = 1 #-- increment if you want to thin out the vectors

    vplot = ax.quiver(lon[::incr], lat[::incr],
                      u[::incr,::incr].values,
                      v[::incr,::incr].values,
                      angles='xy',
                      scale=200,
                      color='black',
                      transform=data_crs)

    vref = ax.quiverkey(vplot, 0.91, 1.06, 20,
                        r'$20 \frac{m}{s}$',
                        labelpos='E',
                        coordinates='axes',
                        color='k')

    #-- save to PNG
    plt.savefig('plot_matplotlib_vector_ortho_zoom.png', bbox_inches='tight', dpi=100)

    #-- NorthPolarStereo / SouthPolarStereo
    #
    # Create the two plots using the polar projections at once.
    #
    #-- north polar

    # map projection CRS
    projection = ccrs.NorthPolarStereo()

    fig = plt.figure(figsize=(8,8))

    ax1 = fig.add_subplot(1, 2, 1, projection=projection)
    ax1.set_extent([-180., 180., 60., 90.], crs=data_crs)

    ax1.set_title('Vectors on NorthPolarStereo projection', y=1.08)

    ax1.add_feature(cfeature.COASTLINE.with_scale('50m'), edgecolor='grey', linewidth=0.5)
    ax1.gridlines(draw_labels=True, linewidth=0.5, color='gray',
                 xlocs=range(-180,180,30), ylocs=range(-90,90,30))

    cnplot1 = ax1.pcolormesh(lon, lat, var.values,
                           cmap=cmap,
                           transform=data_crs)
    incr = 2

    vplot1 = ax1.quiver(lon[::incr], lat[::incr],
                        u[::incr,::incr].values,
                        v[::incr,::incr].values,
                        angles='xy',
                        scale=400,
                        color='black',
                        transform=data_crs)

    vref1 = ax1.quiverkey(vplot1, 0.91, 1.06, 20,
                          r'$20 \frac{m}{s}$',
                          labelpos='E',
                          coordinates='axes',
                          color='k')

    # circular boundary of the map
    # (see https://scitools.org.uk/cartopy/docs/v0.15/examples/always_circular_stereo.html)
    theta  = np.linspace(0, 2*np.pi, 100)
    center = [0.5, 0.5]
    radius =  0.5
    verts  = np.vstack([np.sin(theta), np.cos(theta)]).T
    circle = mpath.Path(verts * radius + center)
    ax1.set_boundary(circle, transform=ax1.transAxes)

    #-- south polar

    # map projection CRS
    projection = ccrs.SouthPolarStereo()

    ax2 = fig.add_subplot(1, 2, 2, projection=projection)
    ax2.set_extent([-180., 180., -90., -60.], crs=data_crs)

    ax2.set_title('Vectors on SouthPolarStereo projection', y=1.08)

    ax2.add_feature(cfeature.COASTLINE.with_scale('50m'), edgecolor='grey', linewidth=0.5)
    ax2.gridlines(draw_labels=True, linewidth=0.5, color='gray',
                  xlocs=range(-180,180,30), ylocs=range(-90,90,30))

    cnplot2 = ax2.pcolormesh(lon, lat, var.values,
                             cmap=cmap,
                             transform=data_crs)

    vplot2 = ax2.quiver(lon[::incr], lat[::incr],
                        u[::incr,::incr].values,
                        v[::incr,::incr].values,
                        angles='xy',
                        scale=400,
                        color='black',
                        transform=data_crs)

    vref2 = ax2.quiverkey(vplot2, 0.91, 1.06, 20,
                          r'$20 \frac{m}{s}$',
                          labelpos='E',
                          coordinates='axes',
                          color='k')

    # circular boundary of the map
    ax2.set_boundary(circle, transform=ax2.transAxes)

    #-- Mollweide
    #
    # Map projection CRS
    projection = ccrs.Mollweide()

    # Create the plot
    fig, ax = plt.subplots(figsize=(8,8), subplot_kw=dict(projection=projection))

    ax.set_global()

    ax.set_title('Vectors on Mollweide projection', y=1.08)

    ax.add_feature(cfeature.COASTLINE.with_scale('50m'), edgecolor='grey', linewidth=0.5)
    ax.gridlines(draw_labels=True, linewidth=0.5, color='gray',
                 xlocs=range(-180,180,30), ylocs=range(-90,90,30),
                 x_inline=False, y_inline=False)

    cnplot = ax.pcolormesh(lon, lat, var.values,
                           cmap=cmap,
                           transform=data_crs)
    incr = 3

    vplot = ax.quiver(lon[::incr], lat[::incr],
                      u[::incr,::incr].values,
                      v[::incr,::incr].values,
                      angles='xy',
                      scale=400,
                      color='black',
                      transform=data_crs)

    vref = ax.quiverkey(vplot, 0.78, 1.05, 20,
                        r'$20 \frac{m}{s}$',
                        labelpos='E',
                        coordinates='axes',
                        color='k')
    #-- save to PNG
    plt.savefig('plot_matplotlib_vector_mollweide.png', bbox_inches='tight', dpi=100)

    #-- Robinson
    #
    # Map projection CRS
    projection = ccrs.Robinson()

    # Create the plot
    fig, ax = plt.subplots(figsize=(8,8), subplot_kw=dict(projection=projection))

    ax.set_global()

    ax.set_title('Vectors on Robinson projection', y=1.08)

    ax.add_feature(cfeature.COASTLINE.with_scale('50m'), edgecolor='grey', linewidth=0.5)
    ax.gridlines(draw_labels=True, linewidth=0.5, color='gray',
                 xlocs=range(-180,180,30), ylocs=range(-90,90,30),
                 x_inline=False, y_inline=False)

    cnplot = ax.pcolormesh(lon, lat, var.values,
                           cmap=cmap,
                           transform=data_crs)
    incr = 3

    vplot = ax.quiver(lon[::incr], lat[::incr],
                      u[::incr,::incr].values,
                      v[::incr,::incr].values,
                      angles='xy',
                      scale=400,
                      color='black',
                      transform=data_crs)

    vref = ax.quiverkey(vplot, 0.78, 1.08, 20,
                        r'$20 \frac{m}{s}$',
                        labelpos='E',
                        coordinates='axes',
                        color='k')


if __name__ == '__main__':
    main()
Plot result:

