Python: PyVista - scalarbar properties#
Description
Unluckily, pyvista provides very little information on how to customize the scalarbar. Below are a few examples of how to customize it.
Content
Download coastlines
Example data
Plotting - Using the defaults for the scalarmap - default (horizontal) - default (vertical) - scalarbars properties - rotate scalarbar title string - change scalarbar background color - get and set scalarbar properties - two horizontal scalarbars next to each other
Software requirements
Python 3
numpy
xarray
pyvista
Example script#
colorbar_or_scalarbar_properties.py
#!/usr/bin/env python
# coding: utf-8
#
#------------------------------------------------------------------------------
# DKRZ example: pyvista - scalar bar properties
#
# Unluckily, pyvista provides very little information on how to customize the
# scalarbar. Below are a few examples of how to customize the scalarbar.
#
# Wording: scalarbar == colorbar == labelbar
#
# See also: https://github.com/pyvista/pyvista/blob/33c1d2c16f4db40ca1cc530b4508734ea9b3cea4/pyvista/plotting/scalar_bars.py
#
#------------------------------------------------------------------------------
# 2026 copyright DKRZ licensed under CC BY-NC-SA 4.0
# (https://creativecommons.org/licenses/by-nc-sa/4.0/deed.en)
#------------------------------------------------------------------------------
import pyvista as pv
import geovista as gv
from pyvista import examples
import numpy as np
import xarray as xr
#------------------------------------------------------------------------------
#-- Download coastlines
#------------------------------------------------------------------------------
#-- We want to draw the coastlines in the plots, and to do this we will use the
#-- data set provided by pyvista.
coastlines = examples.download_coastlines()
#------------------------------------------------------------------------------
#-- Example data
#------------------------------------------------------------------------------
#-- open data file
filename = '/Users/k204045/data/rectilinear_grid_3D.nc'
ds = xr.open_dataset(filename)
#-- Generate the sphereical coordinates from the latitudes, longitudes, and
#-- vertical level.
#-- use the longitudes and latitudes of the input data to generate the mesh
#-- coordinates
xx, yy, zz = np.meshgrid(np.deg2rad(ds.lon), np.deg2rad(ds.lat), [0])
#-- transform the input coordinates to spherical coordinates
radius = 1.
x = radius * np.cos(yy) * np.cos(xx)
y = radius * np.cos(yy) * np.sin(xx)
z = radius * np.sin(yy)
#-- Crearte a structured 3d-grid from the longitudes, latitudes, and one
#-- vertical level and add the example data.
#-- create a structured grid object
grid = pv.StructuredGrid(x, y, z)
#-- add data to the structured grid object
grid['t'] = np.array(ds.t[0,0,:,:]).ravel(order='F')
#------------------------------------------------------------------------------
#-- Plotting
#------------------------------------------------------------------------------
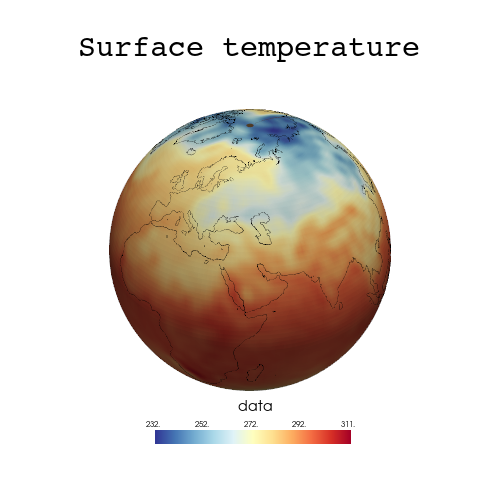
#-- Let us play with the scalarbar properties that allows us to set width,
#-- height, position, and many other things. But first let's see how the
#-- defaults look like, therefore we set the window size to (500,500).
#--
#-- Using the defaults for the scalarmap
#--
#-- Using `plotter.add_mesh(... , show_scalar_bar=True)`
#-- choose a colormap
cmap='RdYlBu_r'
#------------------------------------------------------------------------------
# Default (horizontal)
#------------------------------------------------------------------------------
#-- create the plotter
plotter = pv.Plotter(window_size=(500,500))
#-- add the data to the plotter
plotter.add_mesh(grid, cmap=cmap, lighting=True, show_scalar_bar=True)
#-- add a title string
plotter.add_title('Surface temperature', font='courier', color='k', font_size=12)
#-- add coastlines to the plotter
actor = plotter.add_mesh(coastlines, color='black', line_width=0.5)
#-- display the result
plotter.show()
#------------------------------------------------------------------------------
# Default (vertical)
#------------------------------------------------------------------------------
#-- create the plotter
plotter = pv.Plotter(window_size=(500,500))
#-- add the data to the plotter
plotter.add_mesh(grid, cmap=cmap, lighting=True, scalar_bar_args=dict(vertical=True))
#-- add a title string
plotter.add_title('Surface temperature', font='courier', color='k', font_size=12)
#-- add coastlines to the plotter
actor = plotter.add_mesh(coastlines, color='black', line_width=0.5)
#-- display the result
plotter.show()
#------------------------------------------------------------------------------
#-- Scalarbars properties
#--
#-- The default settings of the scalarbar is not centered to the 3d-object
#-- either in horizontal position nor in vertical position. That is not what we
#-- like. pyvista allows us to customize the scalarbar by its properties.
#--
#-- In the next examples we use properties like width, height, position_x,
#-- position_y, and more to customize the scalarbar look.
#------------------------------------------------------------------------------
#-- create the plotter
plotter = pv.Plotter(window_size=(500,500))
#-- add the data to the plotter
actor = plotter.add_mesh(grid, name='data_mesh', cmap=cmap, lighting=True, show_scalar_bar=False)
#-- set scalar bar properties
sbar_args = dict(vertical=False,
width=0.4,
position_y=0.11,
interactive=False,
title_font_size=14,
label_font_size=8,
outline=False)
sbar_offset = -10. #-- add more space between scalar bar title and the color labels
sbar = plotter.add_scalar_bar('data', position_x=0.31, **sbar_args)
sbar.GetTitleTextProperty().SetLineOffset(sbar_offset)
#-- add a title string
plotter.add_title('Surface temperature', font='courier', color='k', font_size=12)
#-- add coastlines to the plotter
actor = plotter.add_mesh(coastlines, color='black', line_width=0.5)
#-- display the result
plotter.show()
#------------------------------------------------------------------------------
#-- create the plotter
plotter = pv.Plotter(window_size=(500,500))
#-- add the data to the plotter
plotter.add_mesh(grid, name='data_mesh', cmap=cmap, lighting=True, show_scalar_bar=False)
#-- set scalar bar properties
sbar_args = dict(vertical=True,
width=0.06,
height=0.4,
position_x=0.82,
position_y=0.3,
interactive=False,
title_font_size=14,
label_font_size=8,
outline=False)
sbar_offset = -10. #-- add more space between scalar bar title and the color labels
#-- add scalar bar
sbar = plotter.add_scalar_bar('topography', **sbar_args)
sbar.GetTitleTextProperty().SetLineOffset(sbar_offset)
#-- add a title string
plotter.add_title('Surface temperature', font='courier', color='k', font_size=12)
#-- add coastlines to the plotter
actor = plotter.add_mesh(coastlines, color='black', line_width=0.5)
#-- display the result
plotter.show()
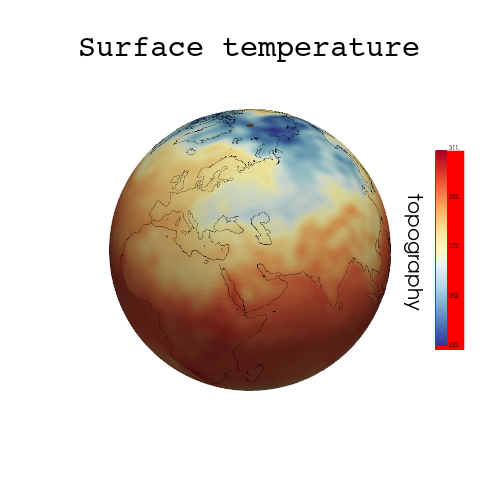
#------------------------------------------------------------------------------
#-- Rotate scalarbar title string
#--
#-- Unfortunately it is not possible to change the orientation (rotate) the scalarbar title string, therefore we have to use the `plotter.add_text()` method.
#------------------------------------------------------------------------------
#-- create the plotter
plotter = pv.Plotter(window_size=(500,500))
#-- add the data to the plotter
plotter.add_mesh(grid, name='data_mesh', cmap=cmap, lighting=True, show_scalar_bar=False)
#-- set scalar bar properties
sbar_args = dict(vertical=True,
width=0.06,
height=0.4,
position_x=0.87,
position_y=0.3,
interactive=False,
title_font_size=14,
label_font_size=6,
outline=False)
sbar_offset = -10. #-- add more space between scalar bar title and the color labels
#-- add scalar bar
sbar = plotter.add_scalar_bar('', **sbar_args)
sbar.GetTitleTextProperty().SetLineOffset(sbar_offset)
#-- use .add_text to rotate the scalar bar title string
plotter.add_text('topography', font_size=10, viewport=True, position=(0.81, 0.61), orientation=270.)
#-- add a title string
plotter.add_title('Surface temperature', font='courier', color='k', font_size=12)
#-- add coastlines to the plotter
actor = plotter.add_mesh(coastlines, color='black', line_width=0.5)
#-- display the result
plotter.show()
#------------------------------------------------------------------------------
#-- Change scalarbar background color
#------------------------------------------------------------------------------
#-- create the plotter
plotter = pv.Plotter(window_size=(500,500))
#-- add the data to the plotter
plotter.add_mesh(grid, name='data_mesh', cmap=cmap, lighting=True, show_scalar_bar=False)
#-- set scalar bar properties
sbar_args = dict(vertical=True,
width=0.06,
height=0.4,
position_x=0.87,
position_y=0.3,
interactive=False,
title_font_size=14,
label_font_size=6,
outline=False,
background_color=(255, 0, 0))
sbar_offset = -10. #-- add more space between scalar bar title and the color labels
#-- add scalar bar
sbar = plotter.add_scalar_bar('', **sbar_args)
sbar.GetTitleTextProperty().SetLineOffset(sbar_offset)
sbar.DrawBackgroundOn() #-- has to be set because there is a bug in add_scalar_bar
#-- use .add_text to rotate the scalar bar title string
plotter.add_text('topography', font_size=10, viewport=True, position=(0.81, 0.61),
orientation=270.)
#-- add a title string
plotter.add_title('Surface temperature', font='courier', color='k', font_size=12)
#-- add coastlines to the plotter
actor = plotter.add_mesh(coastlines, color='black', line_width=0.5)
#-- display the result
plotter.show()
#------------------------------------------------------------------------------
#-- Get and set scalarbar properties
#--
#-- With the method `sbar.GetProperty()` some properties can be retrieved and set.
#------------------------------------------------------------------------------
print(sbar.GetProperty())
print(sbar.GetBackgroundProperty().GetColor())
print(sbar.GetBackgroundProperty().SetColor((255,0,0)))
print(sbar.GetBackgroundProperty().GetDisplayLocation())
#print(scalar_bar.SetPosition(position_x, position_y))
print(f'sbar position : {sbar.GetPosition()}')
print(f'sbar width : {sbar.GetWidth()}')
print(f'sbar height : {sbar.GetHeight()}')
title_y = sbar.GetPosition()[1] + sbar.GetHeight()/2
print(title_y)
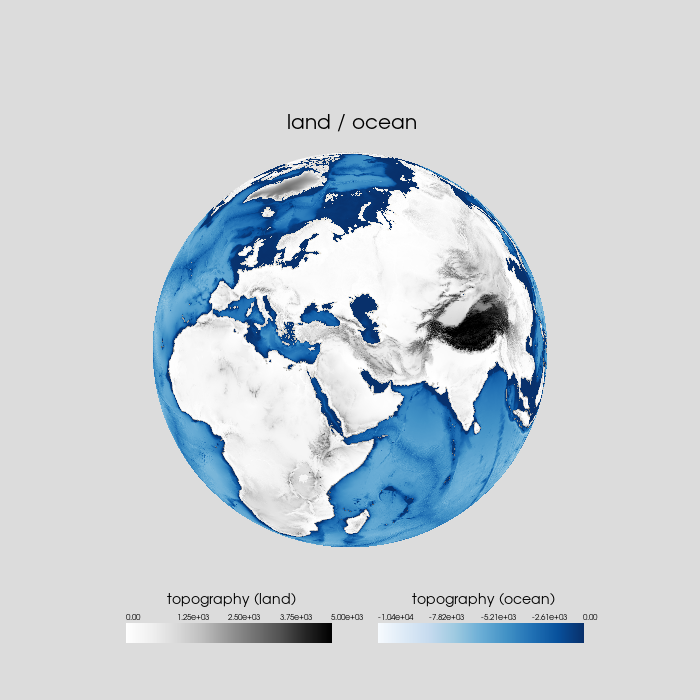
#------------------------------------------------------------------------------
#-- Two horizontal scalar bars next to each other
#--
#-- The next example, we show how to create two scalarbars that are horizontally adjacent to each other.
#------------------------------------------------------------------------------
#-- there are warnings that geovista can't find the CRS of the meshs
#-- but the result looks good
plotter = gv.GeoPlotter(window_size=(700,700))
plotter.set_background('gainsboro') #-- set background color
pv.global_theme.font.family = 'arial' #-- set font type
#-- add title string
plotter.add_text('land / ocean', viewport=True, position=(0.41, 0.81), font_size=10)
#-- add sphere below land and ocean topography to get rid of the
#-- 'transparency always ON' problem
sphere = pv.Sphere(radius=1.0, theta_resolution=100, phi_resolution=100)
plotter.add_mesh(sphere, color='white', show_edges=False, opacity=1.,zlevel=-20)
#-- get topography data
land = examples.download_topo_land()
ocean = examples.download_topo_global()
ocean['altitude'] = np.where(ocean['altitude'] < 0, ocean['altitude'], np.nan)
#-- common scalar bar properties for both bars
sbar_args = dict(vertical=False,
width=0.3,
position_y=0.08,
interactive=False,
title_font_size=14,
label_font_size=8,
outline=False,)
sbar_offset = -10. #-- add mor space between scalar bar title and the color labels
#-- add the land topography
plotter.add_mesh(land,
clim=[0,5000],
cmap="Greys",
lighting=False,
show_scalar_bar=False)
#-- add scalarbar
sbar1 = plotter.add_scalar_bar('topography (land)', position_x=0.18, **sbar_args)
sbar1.GetTitleTextProperty().SetLineOffset(sbar_offset)
#sbar1.GetTitleTextProperty().line_offset = sbar_offset #-- same as above
#-- add the ocean topography
plotter.add_mesh(ocean,
cmap="Blues",
use_transparency=False,
#smooth_shading=True,
nan_color='white',
nan_opacity=0,
lighting=False,
show_scalar_bar=False)
#-- add scalar bar
sbar2 = plotter.add_scalar_bar('topography (ocean)',
position_x=0.54,
**sbar_args)
sbar2.GetTitleTextProperty().SetLineOffset(sbar_offset)
#-- write output to file
plotter.save_graphic('plot_pyvista_scalarbar_2_bars.pdf')
plotter.show()
Plot result#