Posts in visualization
About data on curvilinear or rotated regional grids
- 29 November 2021
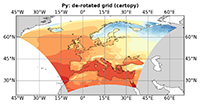
2D Climate data can be sampled using different grid types and topologies, which might make a difference when it comes to data analysis and visualization. As the grid lines of regular or rectilinear grids are aligned with the axes of the geopgraphical lat-lon coordinate system, these model grids are relatively easy to deal with. A common, but more complex case is that of a curvilinear or a rotated (regional) grid. In this blog article we want to illuminate this case a bit; we describe how to identify a curvilinear grid, and we demonstrate how to visualize the data using the “normal” cylindric equidistant map projection.
Data can not only be stored in different file formats (e.g. netCDF, GRIB), but also in different data structures. Besides its spatial dimension (e.g. 1D, 2D, 3D), we need to have a closer look at the grid and the topology used. As the time dependency of the data is encoded as the time dimension, a variable might be called a 3D variable although the spatial grid is only 2D.