Debugging#
Debugging is a crucial part of the code development and tuning cycle - either if bugs are introduced by optimization or by new code pieces.
Parallel debugging with ARM DDT#
In addition to command-line debuggers like gdb the graphical debugger
DDT can be used that is especially suited for scalar, multi-threaded and
large-scale parallel applications written in C, C++ and Fortran (up to 1600 MPI processes).
The lecture of DDT Users Guide
is recommended.
Getting started#
To debug an application, (re-)compile it with
-gand low optimization-O0. For the Intel compiler you might also have to deactivate inlining and IP optimizations, i.e.-fnoinline -no-ip
Note
Programs without the -g flag are able to connect to DDT but its processes might never get ready.
If you are not using shared libraries, you will have to explicitly relink against the memory debugging library in order to use the Memory Debugging feature in DDT. With
DDT_ROOTpointing to/sw/spack-levante/linaro-forge-24.1-st2dsoand using Makefile-Syntax, this would be-L$(DDT_ROOT)/lib/64 -ldmalloc -Wl,--allow-multiple-definitionTo end the debugging session use the menu bar File -> End Session. DDT should automatically finalize the submitted SLURM job(s) when a debugging session is ended (see srun terminate message in the GUI)
Note
Do not scancel a submitted job while the DDT GUI is still connected to it.
This might cause zombie processes on the compute nodes and jobs remaining in closing state
Three separate approaches to debugging are described in the following:
Note
You should not start debugging your application on one of the login nodes directly.
Other possibilites (not documented here):
open core file, e.g. if your previous job crashed and wrote a core (set
ulimit -c unlimitedbefore)
Make sure to replace all placeholder variables in angle brackets like <accounting-group> and
<userid> with the actual values they stand for.
Debug in an interactive session#
Note
This approach allows interactive debugging with DDT in an interactive session on Levante and is the recommended way.
Connect to a login node of Levante with ssh -Y <userid>@levante.dkrz.de.
Start an interactive session with salloc, e.g.
$ salloc --x11 -p interactive -A <accounting-group> -n 1
Additional parameters might be necessary (e.g. requesting more memory) depending on the program to be debugged. After resources are granted, load the linaro-forge module
$ module load linaro-forge/24.1-gcc-13.3.0
Call DDT and pass the program to be debugged and all necessary options (if applicable), e.g.
$ ddt <program>
When debugging MPI-Parallel programs, ddt precedes srun
$ ddt srun <srun-options> <program>
Reverse connect from your local PC to a submitted job on Levante#
Note
This approach allows you to start DDT from your local machine and connect to a submitted job on Levante.
As a prerequisite, download and install the linaro-forge client on your PC/local machine. Go to the official homepage of Linaro, download linaro forge 24.1 for your operating system, and install it.
Note
The version of your local DDT has to match the version used on Levante.
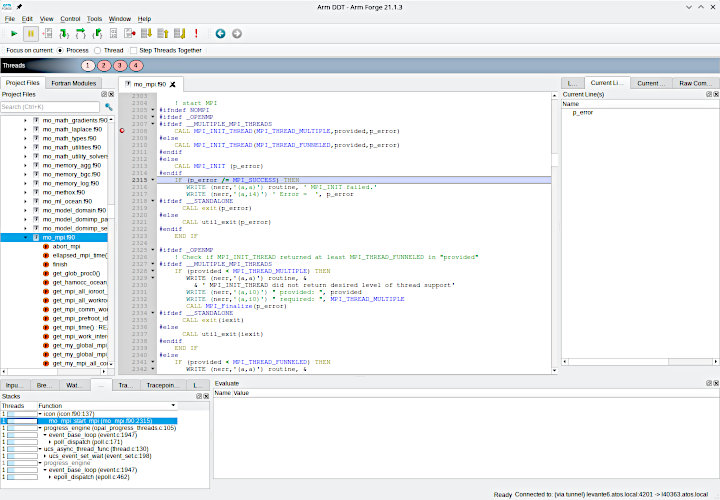
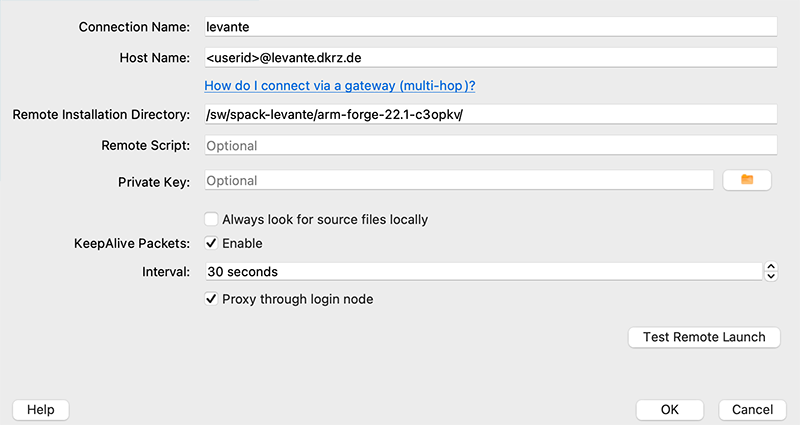
After installing it on your local machine, start DDT and select Remote Launch -> Configure… from the main window. Either Add a new connection or Edit an existing connection to open the Remote Launch Settings window.
Choose a Connection Name and enter <userid>@levante.dkrz.de as Host Name
(So if your userid were b123456 the Host Name would be b123456@levante.dkrz.de).
Set Remote Installation Directory to /sw/spack-levante/linaro-forge-24.1-st2dso and
make sure that Proxy through login node is checked.
Confirm the current configuration with Ok and start the connection in DDT.
Leave DDT as is and open a new connection to Levante with console access (with your console/PuTTY/…).
Prepare a script with a call to the program you want to debug.
Instead of calling the program directly, use ddt --connect <program> in the script
(also don’t forget to include the line module load linaro-forge/24.1-gcc-13.3.0 before that command).
Submit the script with
$ sbatch <script>
If everything worked out, a reverse connection request should automatically open as soon as the job is running
(status “R” in squeue).
Debug a submitted job from an interactive session#
Note
This approach can be useful if work should be done exclusivly on Levante (as in the first approach), but on a submitted job.
Drawback: Two jobs active on Levante (and accounted for) instead of one
As in the first approach, connect to a login node of Levante and
start an interactive session with salloc, e.g.
$ salloc --x11 -p interactive -A <accounting-group> -n 1
Additional parameters might be necessary (e.g. requesting more memory) depending on the program to be debugged. After resources are granted, load the linaro-forge module
$ module load linaro-forge/24.1-gcc-13.3.0
Start DDT in the background with ddt & to keep the shell usable.
(alternatively a second connection to a Levante login node can be established and the following job submission is done there).
There is no need for any Remote Launch configuration of DDT - just start the program and keep it open.
Switch back to the console and adjust your job script to use ddt --connect <program>
instead of calling the program directly.
Submit the job script and a reverse connection request should automatically pop up in the window of DDT.
Note
For this approach it is important to start DDT first and submit the job afterwards.
Tips & Tricks#
Offline debugging#
In some situations interactive work with the DDT debugger is not needed - especially for memory debugging of long running applications one might launch DDT in offline mode. You just need to modify your batch script to prefix the srun call and specify the file where HTML output of DDT should be written to. In addition you might enable memory debugging and set breakpoint where the stack traces are recorded
$ ddt --offline=job.html --mem-debug=thorough --break-at=<file>:<line> srun
The application will run to completion, or to the end of the job. When errors occur, for example an application crash, the stack back trace of crashing processes will be recorded to the offline output file.