Set the background (color/gradient)#
Note
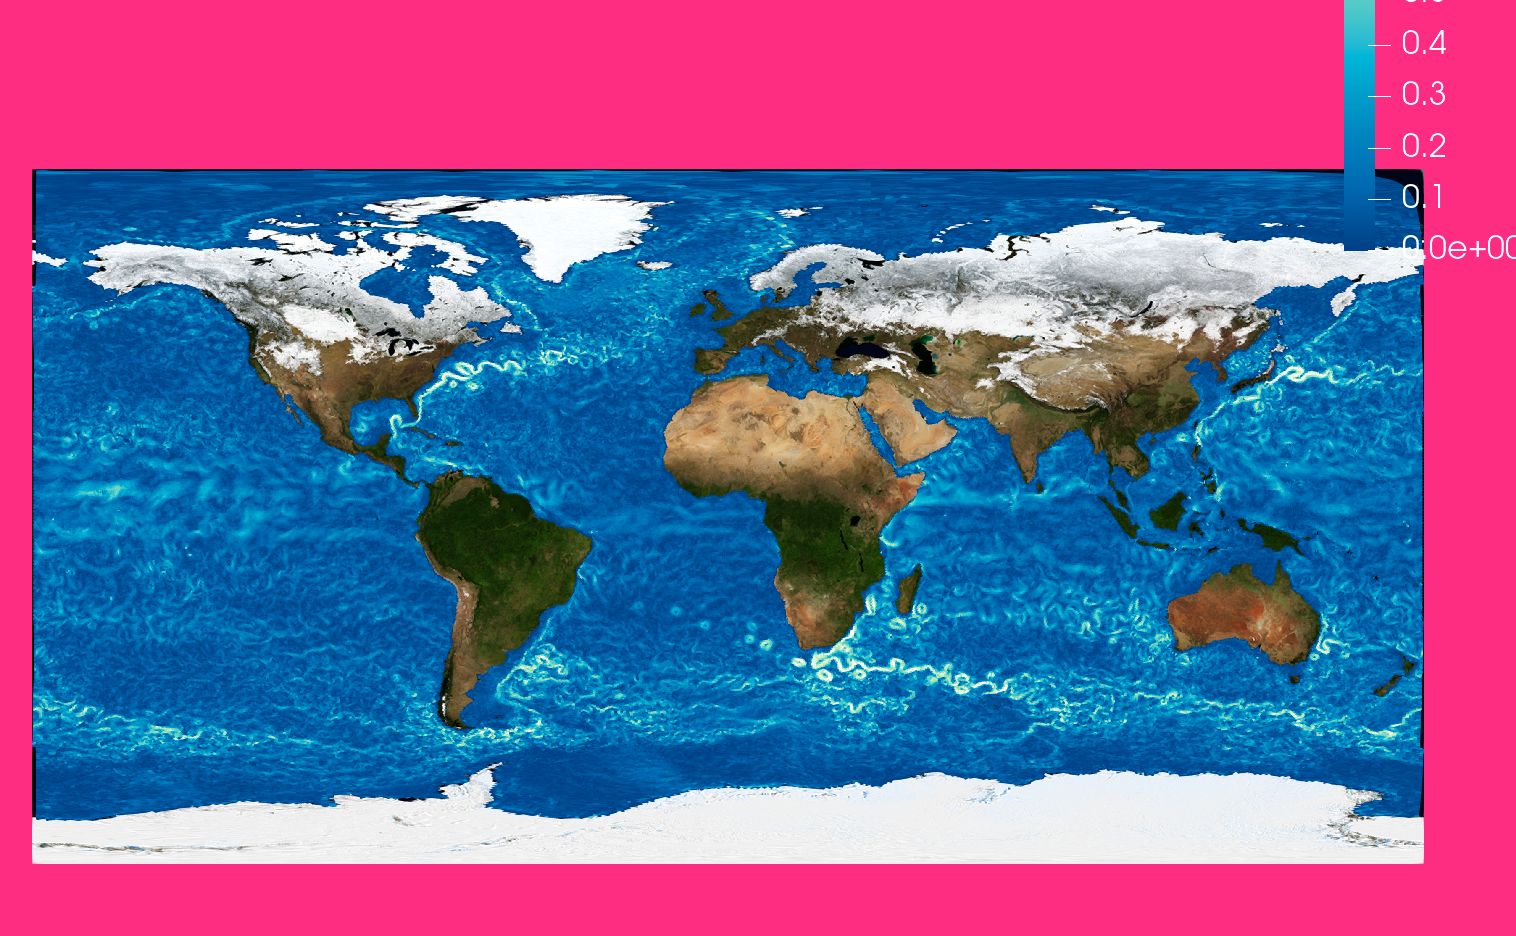
This document is part of a series teaching how to Create an image of sea surface speeds.
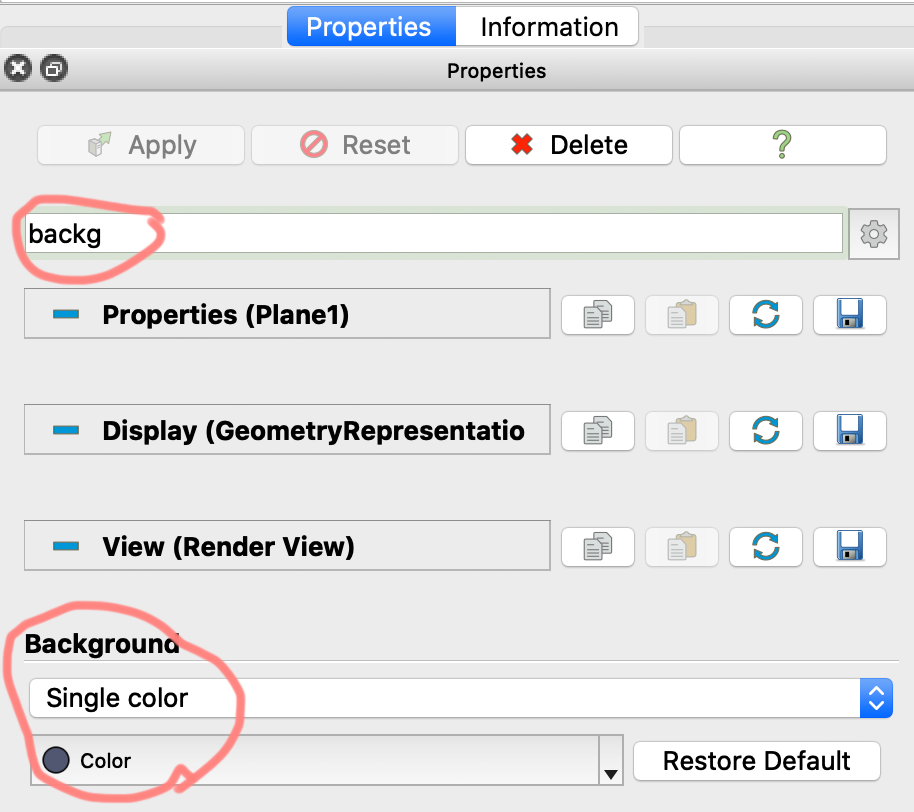
Set the background of the current plot#
To set the background of your current project go to properties of any object, type backg into the text field, and chose a background of your liking. Chosing pink might help looking for holes in your data - or making your plot a bit special.
Next you could Adjust the color bar and its legend
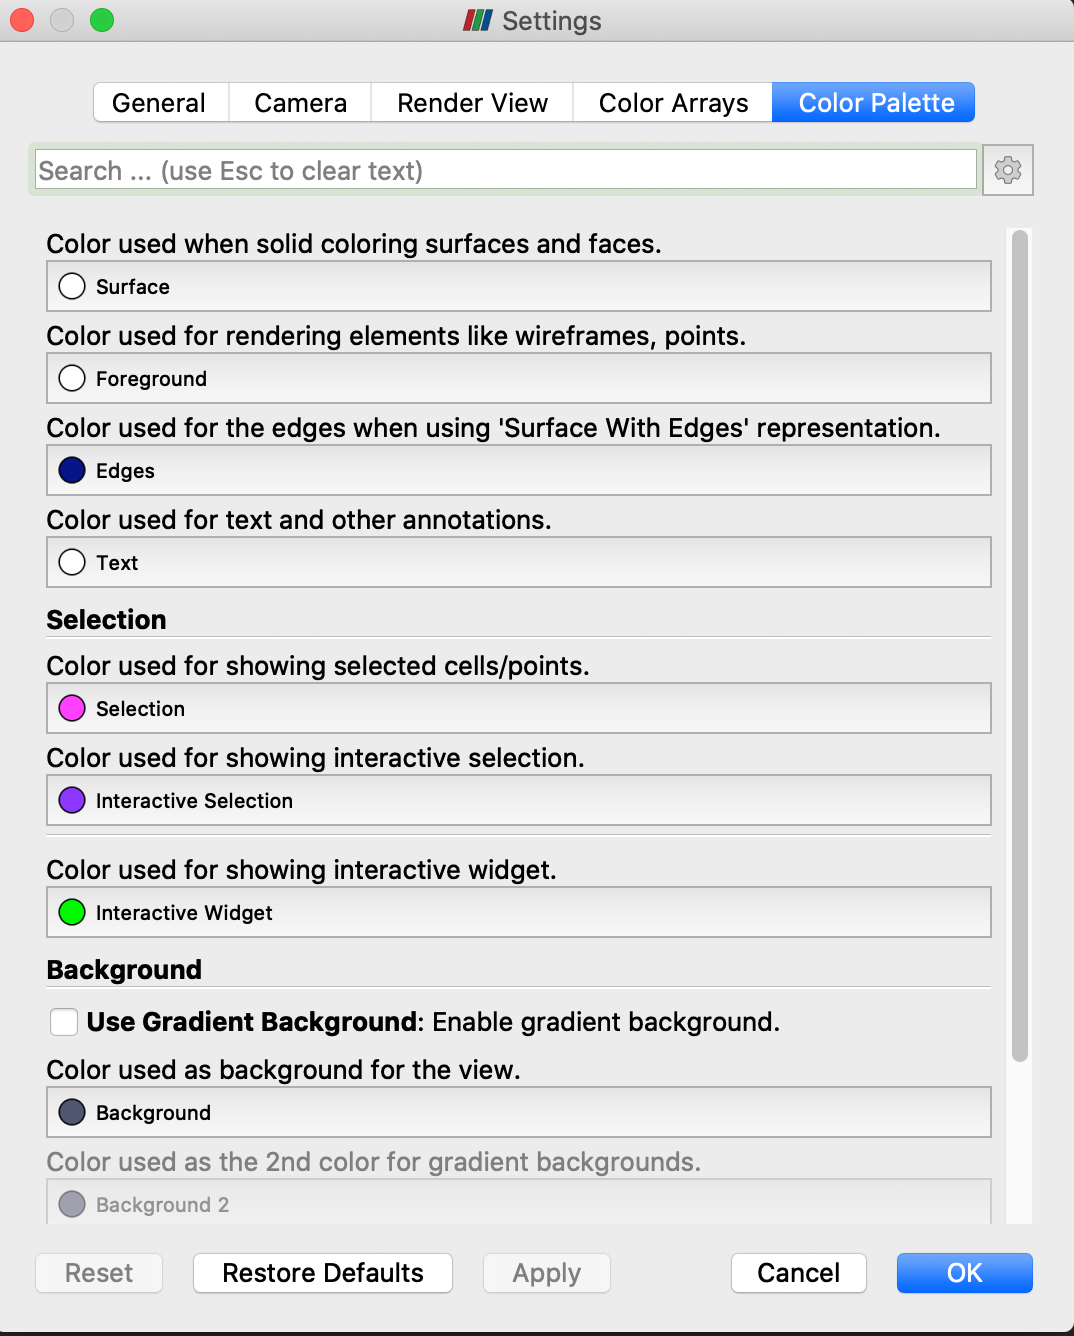
Set the default background#
To set the default background Open the Paraview settings and adjust it in the Color Palette tab