NCL#
Note
Unfortunately, NCL has not been developed any further since 2019, so we strongly recommend switching to Python. Read the ‘Pivot to Python’ information fron NCAR https://www.ncl.ucar.edu/Document/Pivot_to_Python/. The DKRZ can no longer guarantee that the NCL software can be installed on the successor to our Levante computer.
NCL - NCAR Command Language - is an open source interpreted language, designed specifically for scientific data processing and 2D visualization in the field of earth system sciences.
NCL was designed for the analysis and visualization of scientific data, specifically in the area of atmospheric modelling. It combines many features of modern programming languages with a huge number of analysis and visualization functions and examples.
It supports a variety of input file formats like netCDF3/4, GRIB1/2, HDF-SDS, HDF-EOS, HDF5, Shapefiles, Fortran/C binary and ASCII. NCL can also export (write) data to netCDF3, netCDF4, HDF4, HDF5, Binary and ASCII and the graphics output can be saved in PS, EPS, EPSI, PDF, PNG, or to a X11 window for fast debugging.
Plot types#
XY plots |
Contour |
Slices |
Vectors |
Streamlines |
Trajectories |
Scatter plots |
Bar Charts |
Histograms |
Overlays |
Panel plots |
Shapefiles |
At DKRZ, NCL is installed on different platforms in different versions. The environment settings can be loaded using the ‘module load’ function. After loading the module file of NCL, the user does not need to set any further environment variables, as this is done by the module function.
The function call
module apropos ncl
will return the name of the NCL environment module file which can be loaded by
module load <NCL-name>
For example
module load ncl/6.5.0-gccsys
Hint
The tool called ncl_quicklook generates a quick-look plot of variables in the given data file. It can read and display data on a regular or curvilinear grid and in most cases also unstructured data. It is integrated in the NCL software package and was developed here at DKRZ.
By default, if a variable is not specified, ncl_quicklook will list all the available variables and prompt you for a variable name to plot. The visualization can be written to a PNG, PDF, PS, EPS or SVG file. Supported plot types:
contour fill
contour lines
For more information about the tool, type:
ncl_quicklook -h
To try this tool on a sample data file included with NCL, type:
ncl_quicklook -v U $NCARG_ROOT/lib/ncarg/data/cdf/uv300.nc
Examples#
You can find many example plots and the corresponding scripts under NCL examples
Documentation#
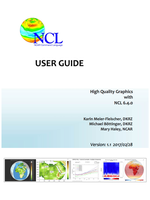
The NCL User Guide v1.1 is an expanded version of DKRZ’s NCL Tutorial.
|
|
The DKRZ’s NCL Regridding tutorial gives an overview how to regrid your data using ESMF.
|
|
The DKRZ’s NCL supplement doc Plot Layout tries to give the user a deeper look to NCL’s title, labelbar, legend, axis or tickmark settings including tips and examples. This document is now part of the official NCL User Guide.
|
|
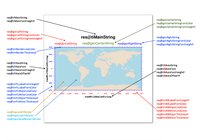
A short graphical overview of the title, axis and tickmark labels.
|
|
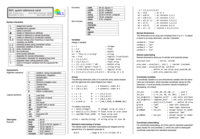
The official NCL quick reference card based on the DKRZ’s NCL scripting language reference card. It provides a quick overview of the NCL scripting language (NCL v6.2.0). NCL scripting language reference card (pdf, 570 KB, 2 pages) |
|
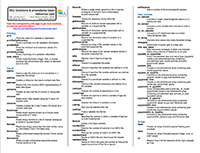
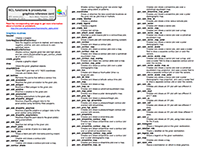
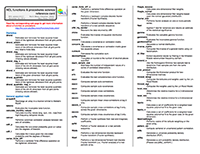
This is a set of reference cards for the NCL functions and procedures available in NCL 6.2.0. The functions and procedures are listed with a short information to give just an overview on them. The user has to go to NCL’s functions web page for further information cause of the huge amount of the functions. NCL reference card functions and procedures:
|
|
NCL reference card functions and procedures:
|
|
NCL reference card functions and procedures:
|
|
EGU 2015 PICO Session ESSI3.2 ”State of the Art in Earth Science Data Visualization” NCL – a workhorse for data analysis and visualization in climate research by Karin Meier-Fleischer, Michael Böttinger, and Mary Haley
|
|
Recommended: use newer official NCL User Guide v1.1 This NCL Tutorial document was developed at DKRZ. It gives an introduction on the use of NCL to interactively visualize typical climate model data or to use it in batch mode by means of NCL scripts. Many examples demonstrate the visualization and data analyzing capabilities of NCL. For users of DKRZ’s visualization facilities: all example scripts and data are available on the mistral’s file system.
|
|
